COVID-19
Scenario Modeling Hub
A Note on Scenario Modeling Hub Round 19 (June 4th, 2025)
General Dynamics
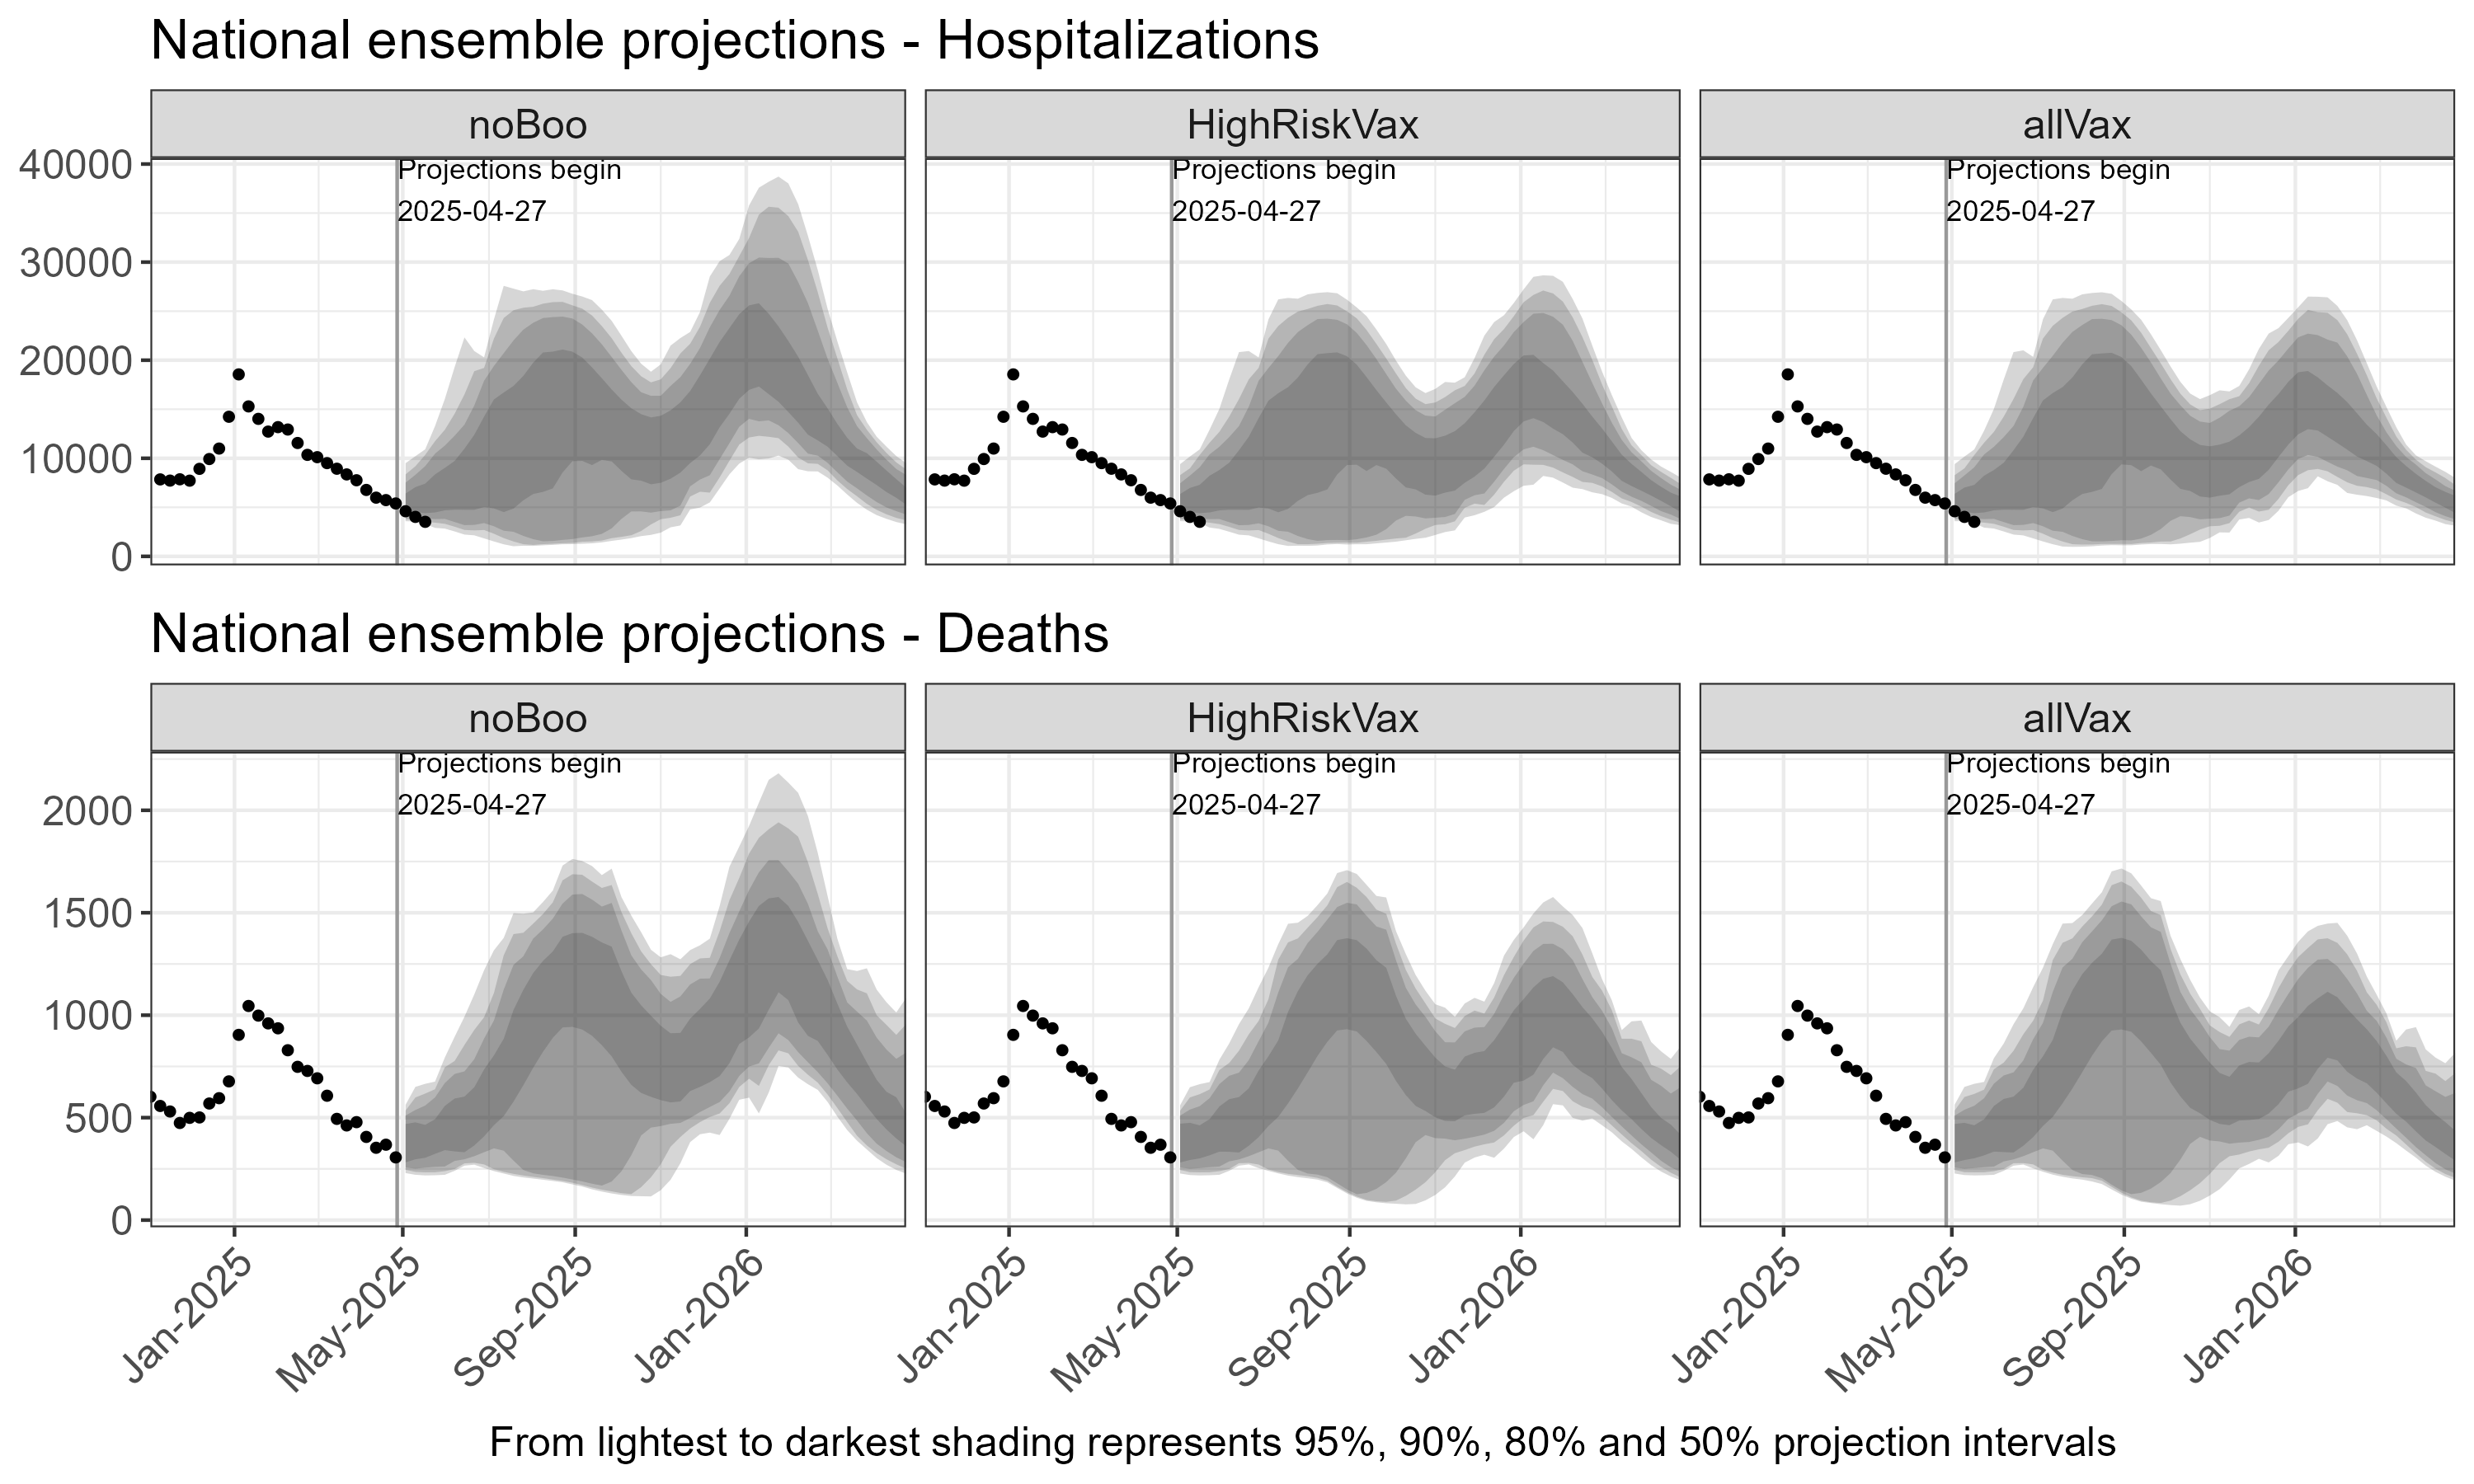
- Based on the national ensemble, we expect two periods of increased COVID-19 activity, in summer 2025 and winter 2025-26, in each scenario, with a first peak projected in late August 2025 and a second peak in January 2026, for both hospitalizations and deaths. Based on the 50% projection interval, both peaks are expected to remain close to that of last winter season (i.e., 20,000 weekly hospitalizations nationally).
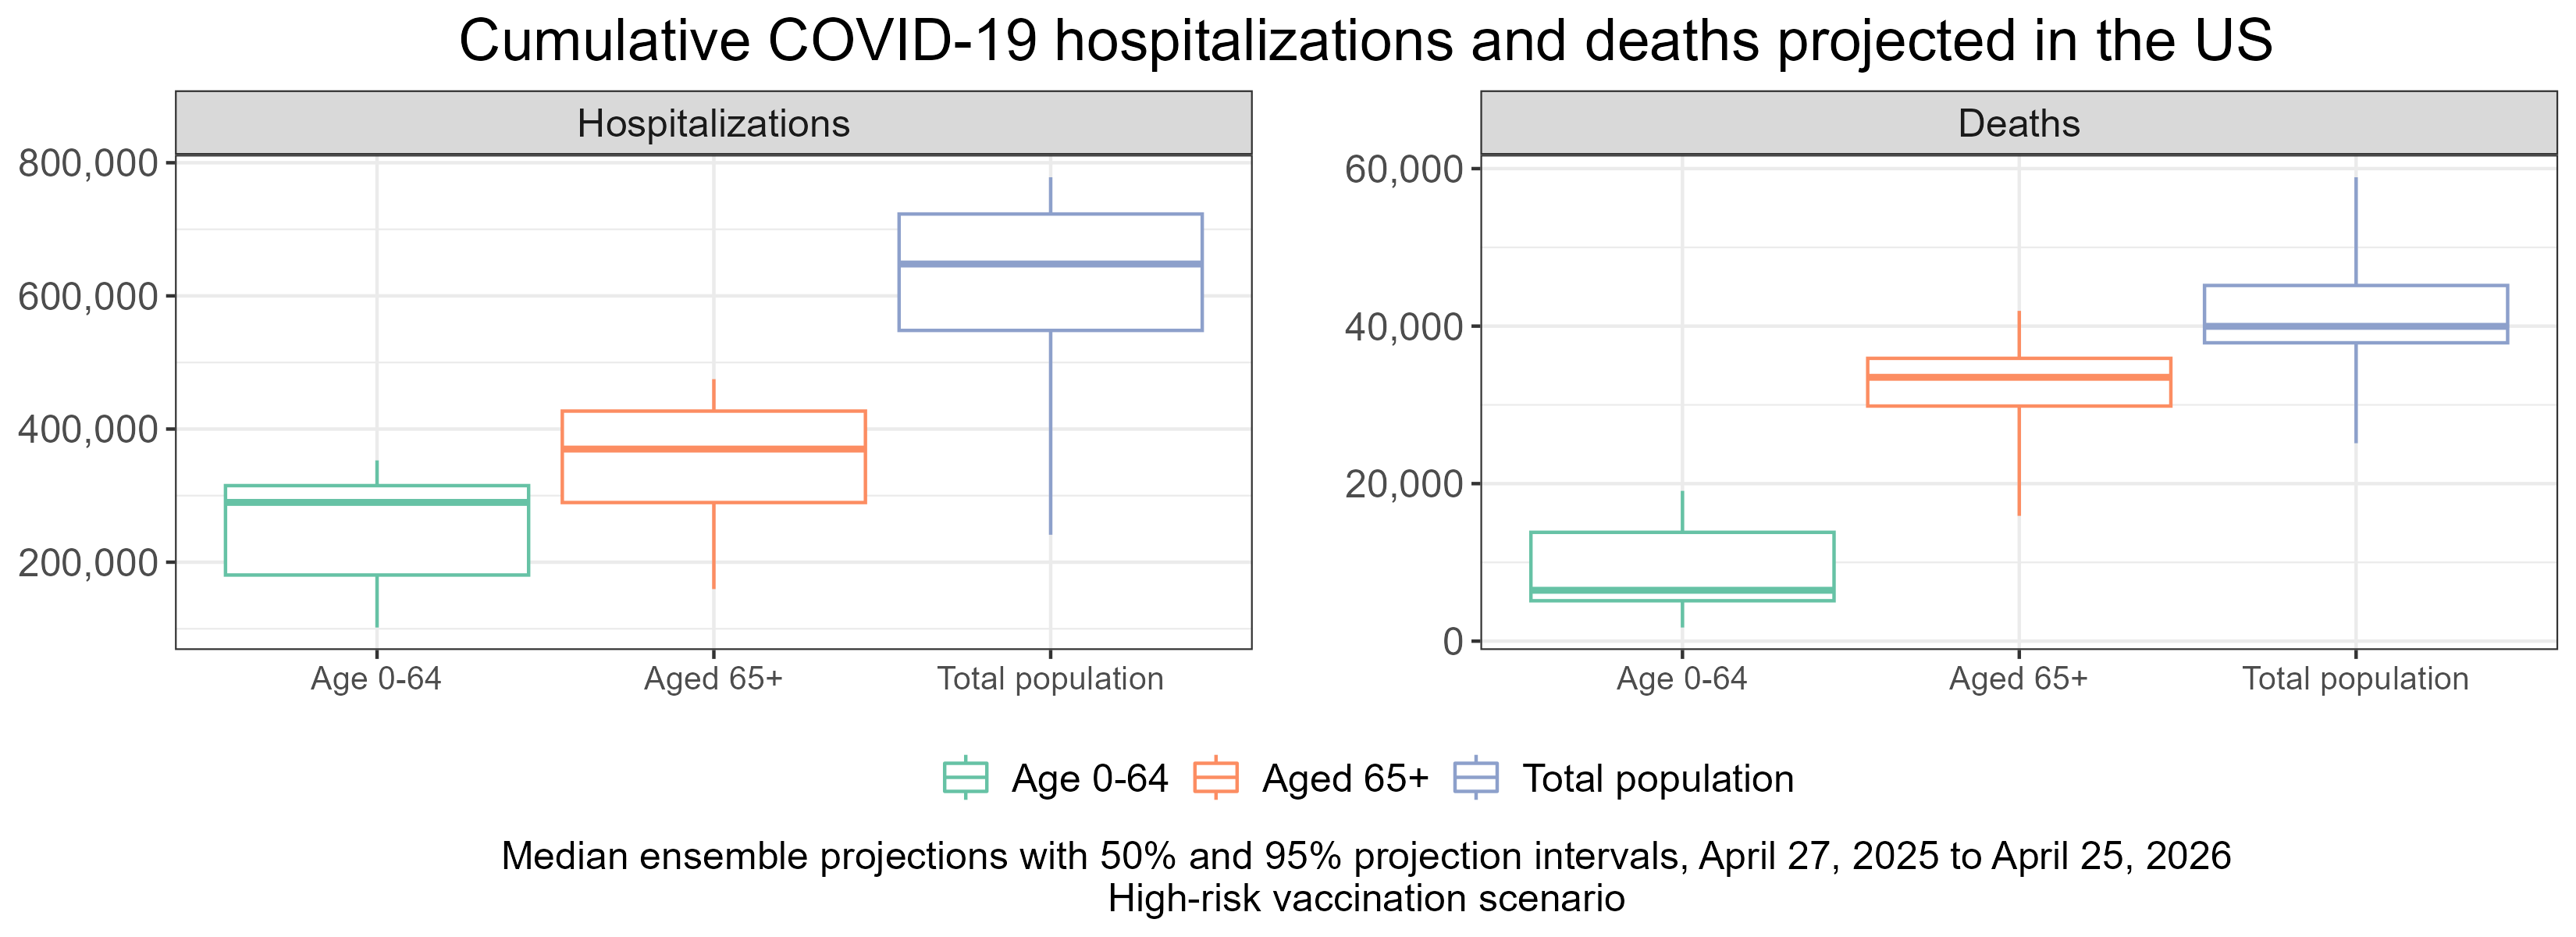
- Among all scenarios, continued substantial burden of disease from COVID-19 is expected, with 648,000 cumulative hospitalizations (95% PI 241,000–778,000) and 40,000 deaths (95% PI 25,000-59,000) due to COVID-19 projected over the course of the projection period (April 27, 2025 to April 25, 2026) in the high risk group scenario (i.e., booster vaccination only among individuals aged 65+ or otherwise at high risk for elevated severity).
- The majority of hospitalization and death burden from COVID-19 is expected to occur in individuals 65+, with 56% of hospitalizations and 84% of deaths occurring in 65+ in the high-risk group recommendation scenario.
Impact of Vaccination
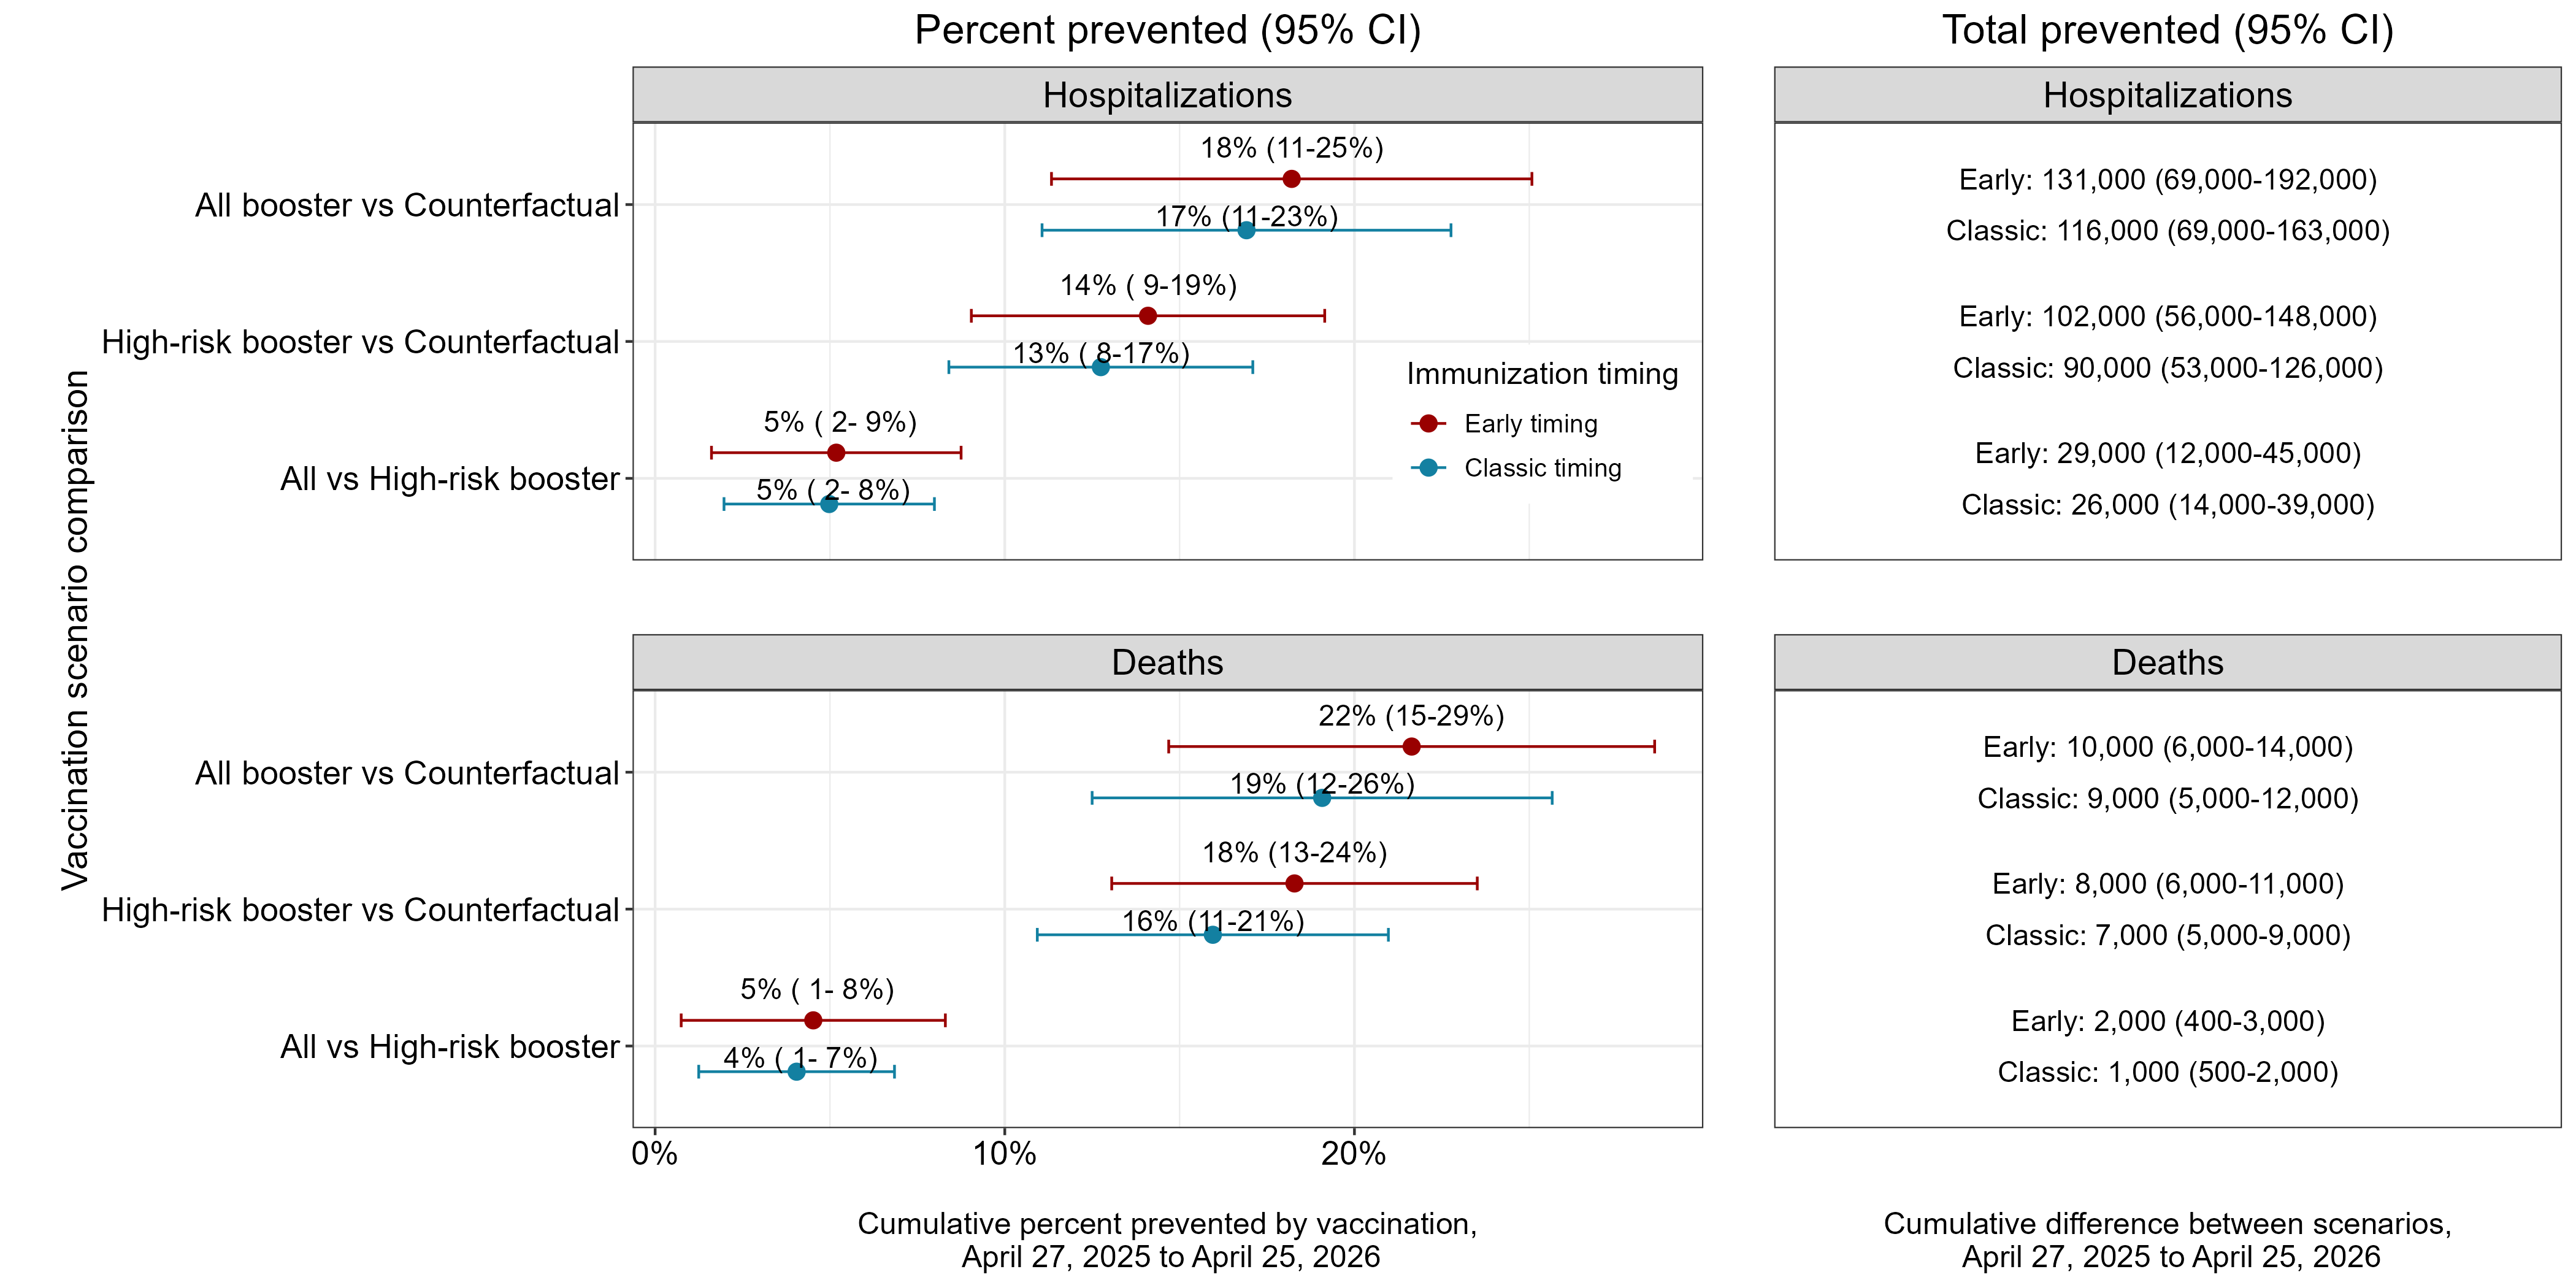
- Both vaccination strategies are projected to significantly reduce disease burden compared to no vaccination.
- Compared to no vaccination, vaccination of high-risk groups reduces hospitalizations by 13% (8-17%) and deaths by 16% (11-23%), over the full time period. Vaccinating high-risk groups would result in 90,000 (53,000-126,000) fewer hospitalizations and 7,000 (4,000-9,000) fewer deaths nationally over the projection period, compared to no vaccination.
- Vaccination for all age groups increases these reductions to 116,000 (69,000-163,000) hospitalizations and 9,000 (5,000-12,000) deaths averted. As compared to vaccinating only 65+ and high-risk individuals, vaccinating all ages would prevent an extra 26,000 hospitalizations and 1,000 deaths.
- The majority of the overall vaccination benefits (i.e., direct and indirect effects) is expected to come from reductions in this age group, with 67,000 (38,000-96,000) hospitalizations and 6,000 (4,000-7,000) deaths averted among 65+ individuals in the high-risk group recommendation scenario compared to no vaccination.
- We estimate that indirect effects of universal vaccine recommendations could reduce disease burden by 4% among people 65+, representing an additional ~12,000 hospitalizations and ~1,000 deaths averted among this age group.
Impact of Vaccination Timing
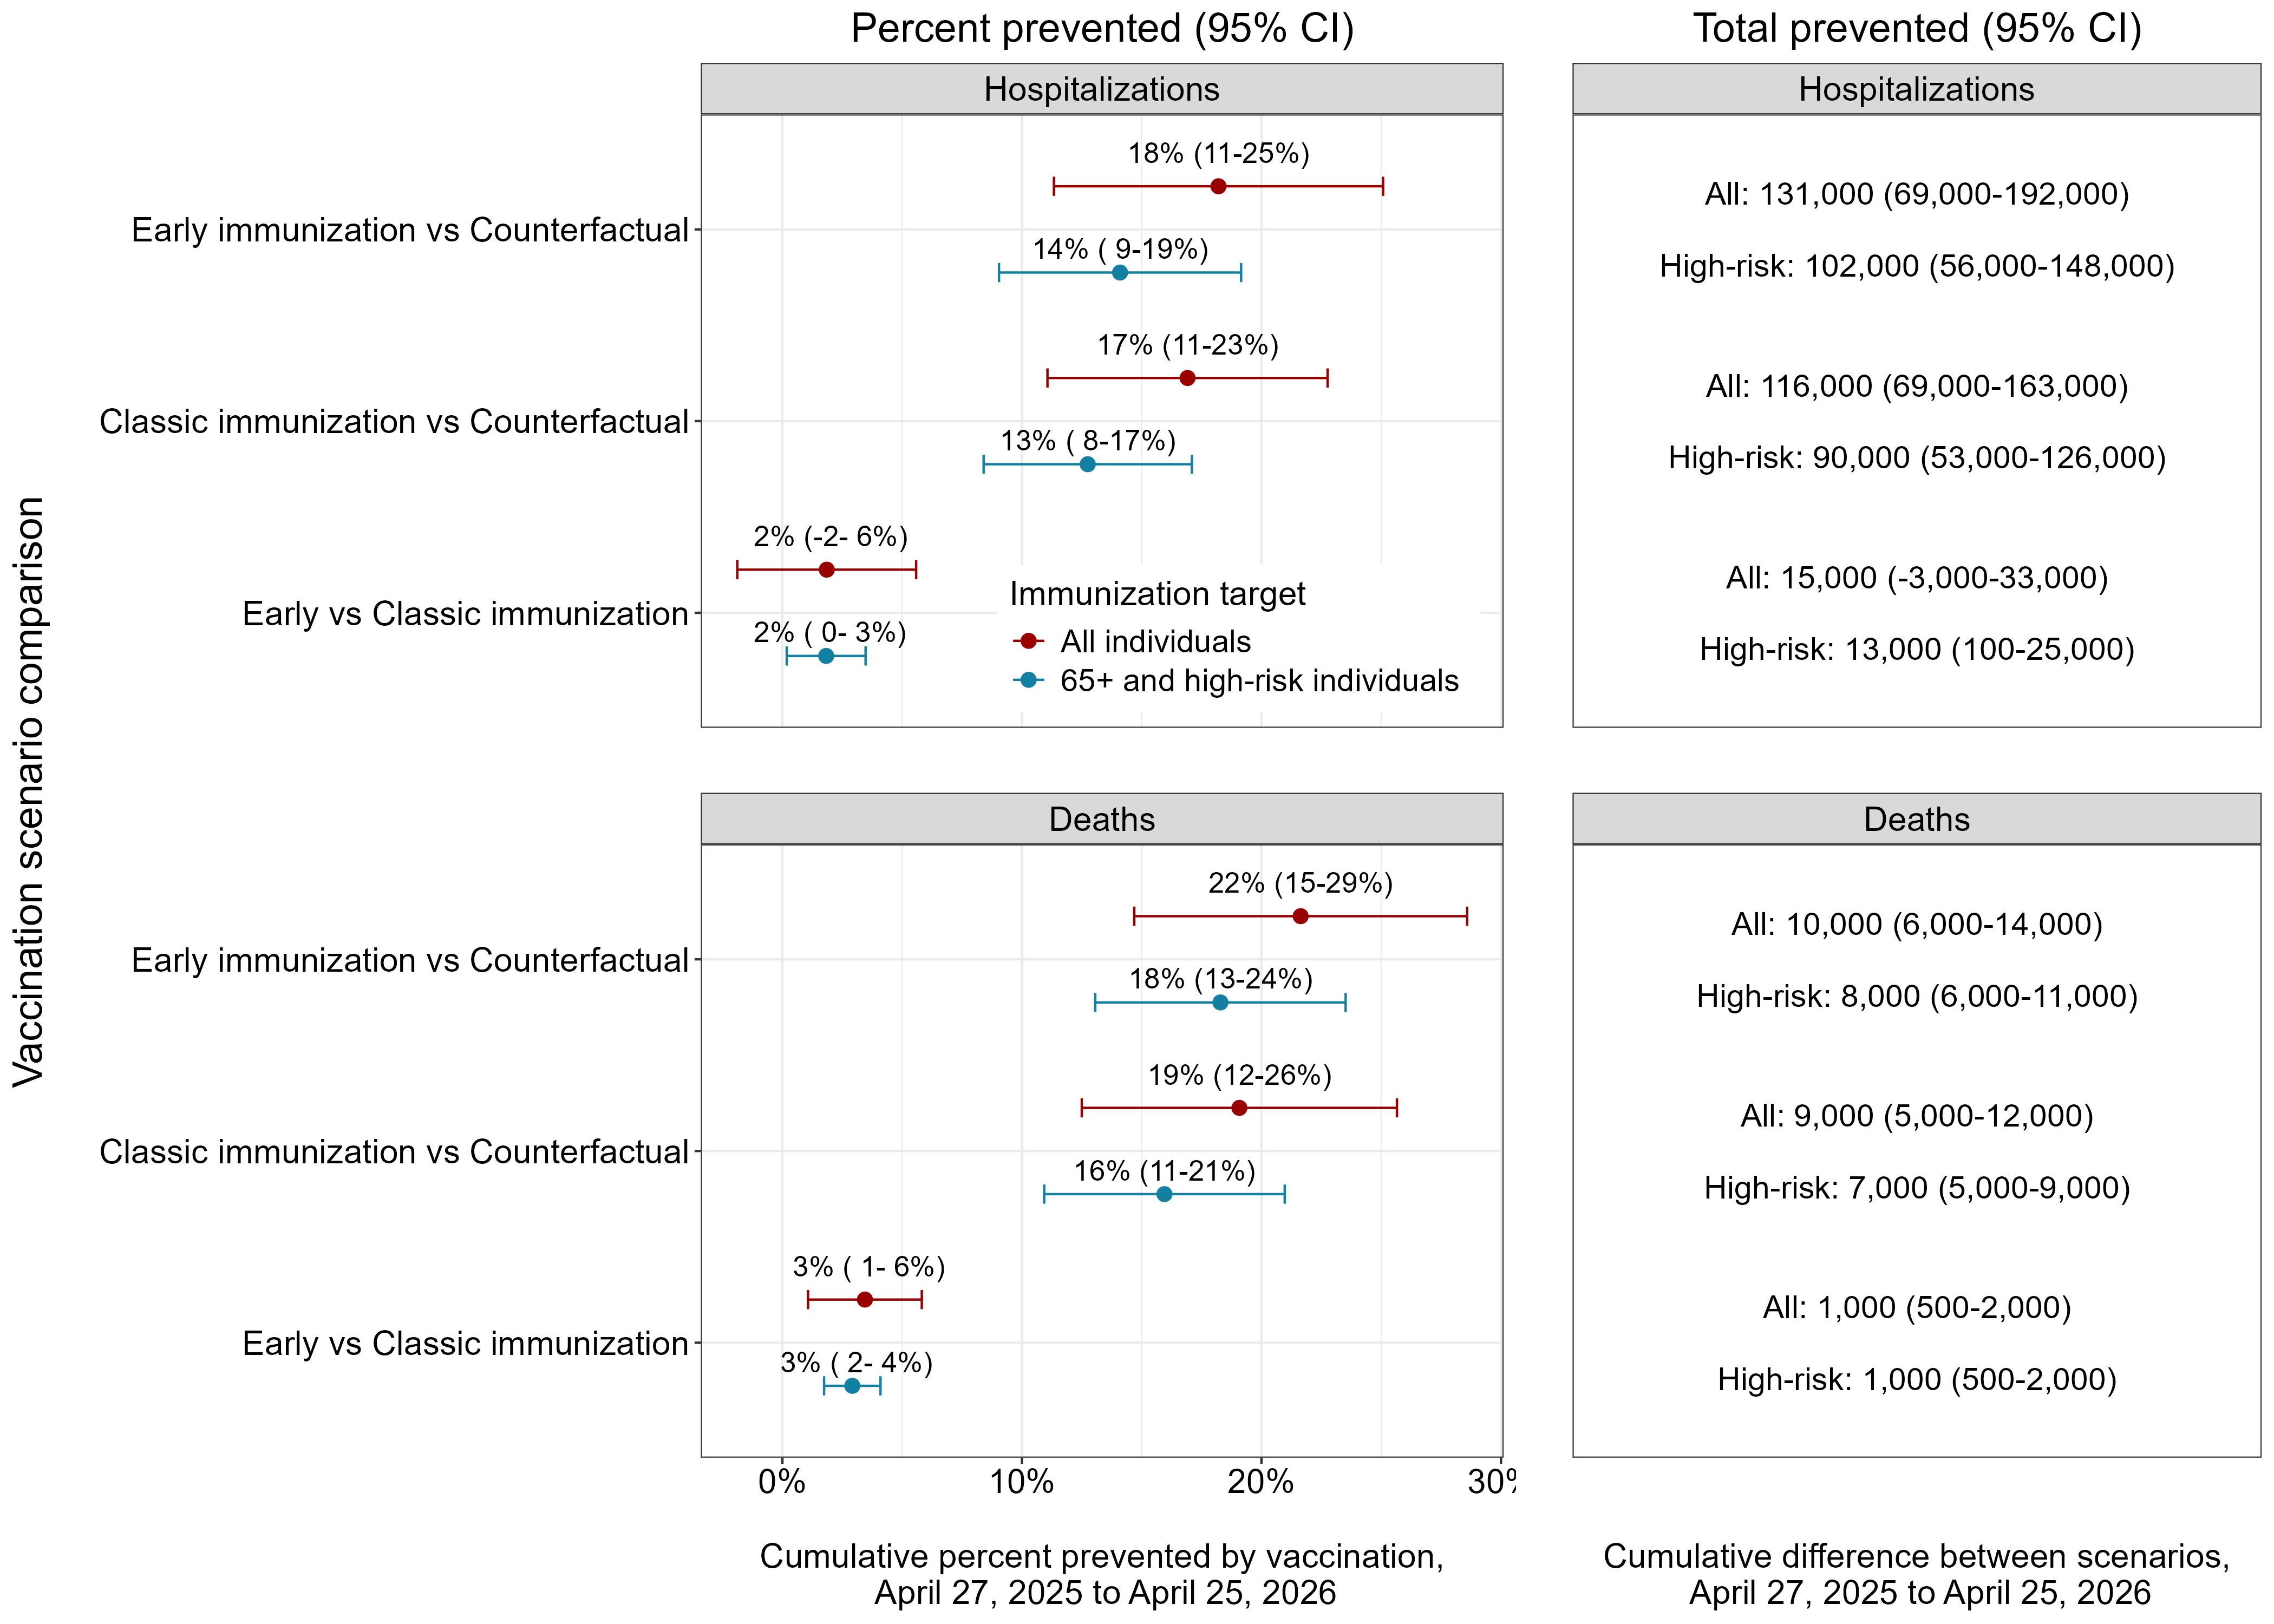
- An earlier vaccination campaign is projected reduce COVID-19 outcomes, compared to classic influenza vaccination timing. Moving the vaccination campaign 1.5 months earlier is projected to reduce the numbers of deaths by 3% (1-6%) and hospitalizations by 2% (-2-6%).
Rationale
Even the best models of emerging infections struggle to give accurate forecasts at time scales greater than 3-4 weeks due to unpredictable drivers such as a changing policy environment, behavior change, the development of new control measures, and stochastic events. However, policy decisions around the course of emerging infections often require projections in the time frame of months. The goal of long-term projections is to compare outbreak trajectories under different scenarios, as opposed to offering a specific, unconditional estimate of what “will” happen.
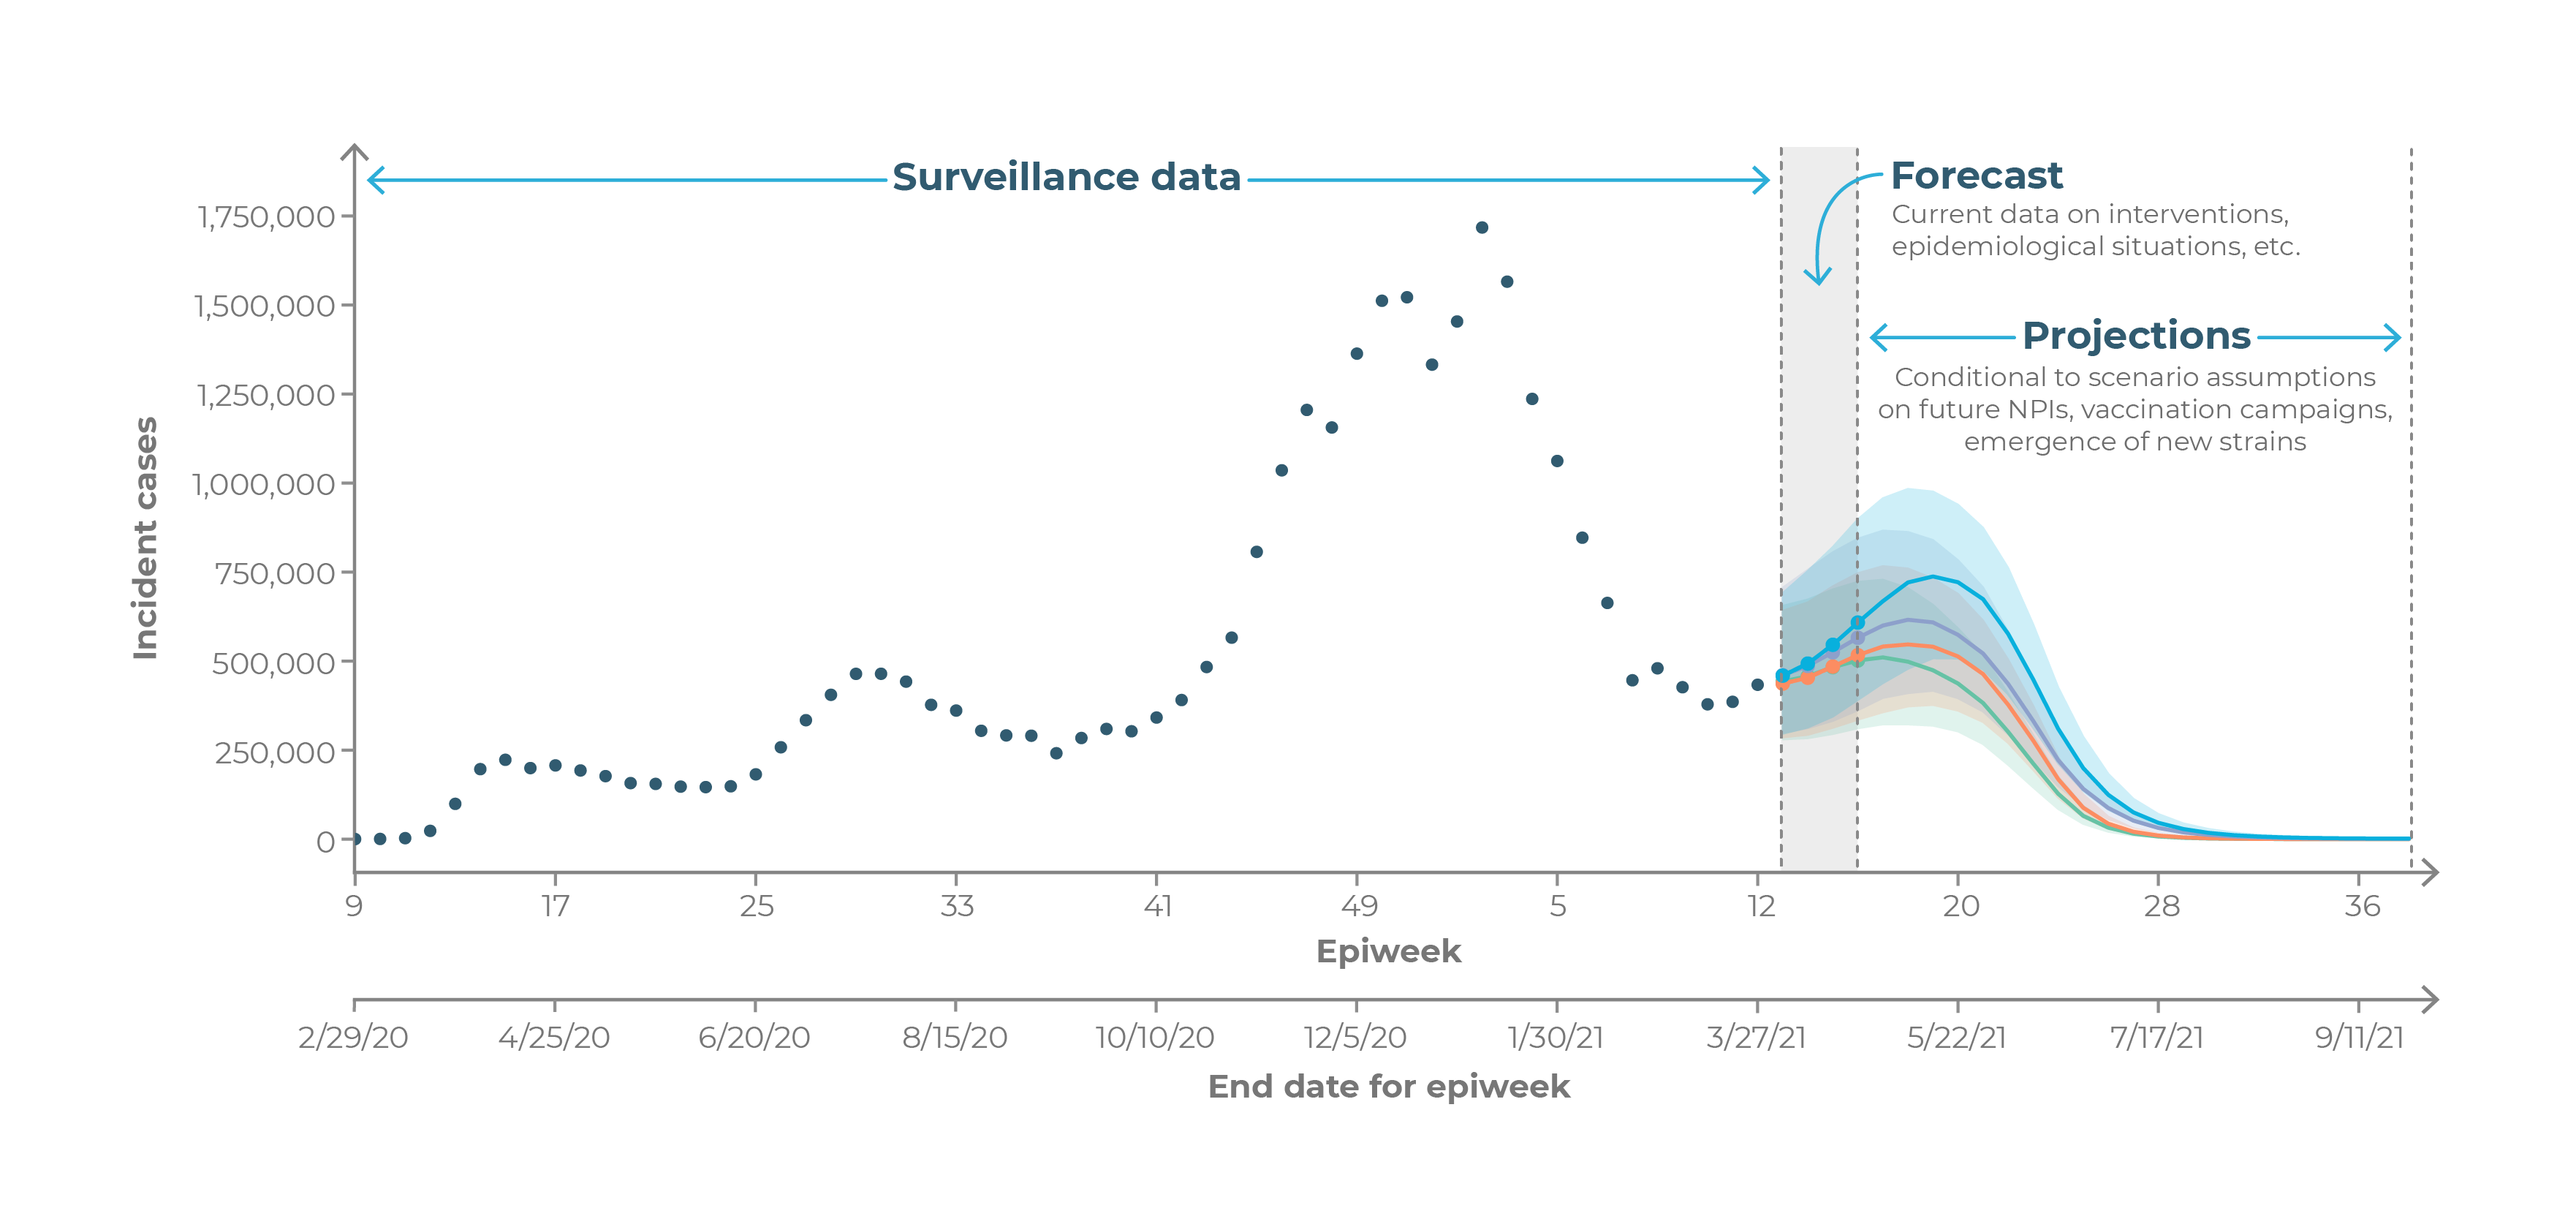
As such, long-term projections can guide longer-term decision-making while short-term forecasts are more useful for situational awareness and guiding immediate response. The need for long-term epidemic projections is particularly acute in a severe pandemic, such as COVID-19, that has a large impact on the economy; for instance, economic and budget projections require estimates of outbreak trajectories in the 3-6 month time scale.