
A Note on Scenario Modeling Hub Round 18 (May 29th, 2024 - Updated on June 27th, 2024)
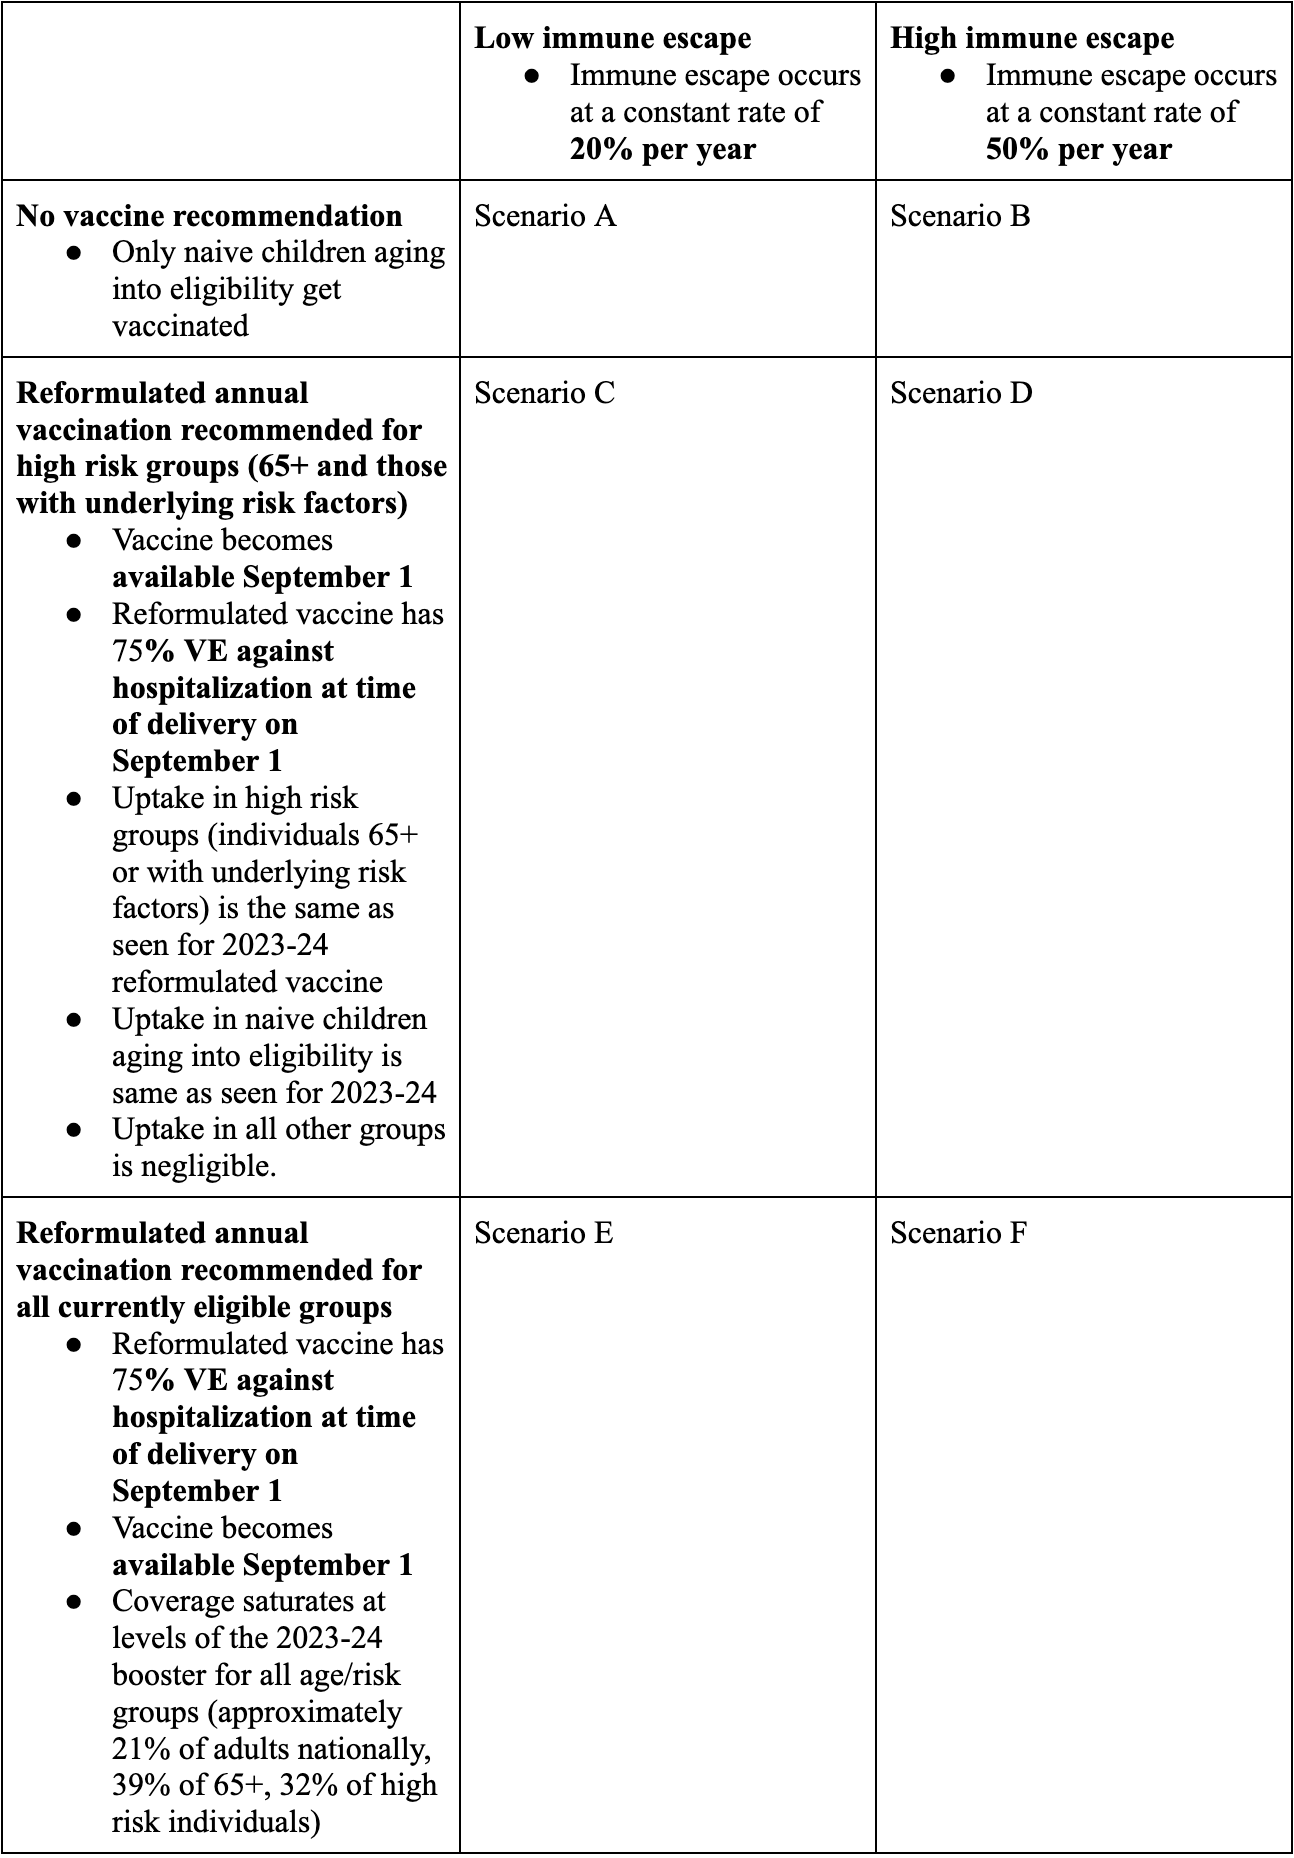
In a new round of projections, the Scenario Modeling Hub evaluated the trajectory of COVID-19 during April 28, 2024 to April 26, 2025 (52-week horizon), under 6 scenarios about the extent of immune escape of circulating variants (50% vs 20% annually) and the annual uptake of reformulated boosters (i) minimal uptake, ii) high-risk group uptake, where vaccination is recommended for individuals under 65 yrs with high-risk conditions and those over 65 yrs, with vaccination coverage mirroring reported levels in these groups in 2023-24, or iii) universal uptake corresponding to 2023-24 coverage levels in the entire US population). Nine teams contributed both national and state-specific projections.
GENERAL DYNAMICS
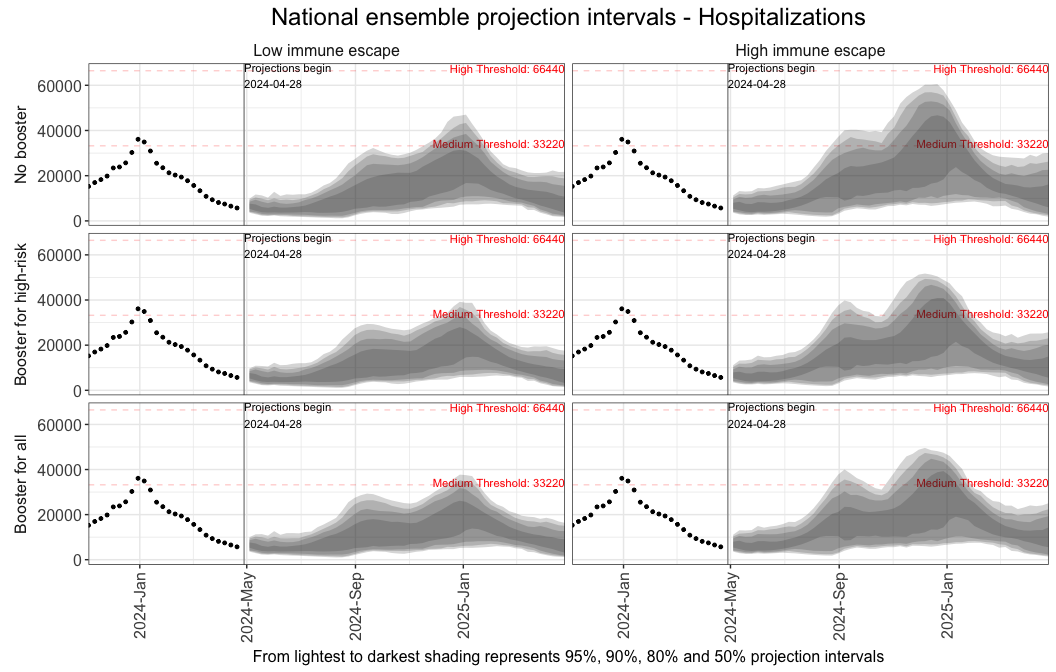
- COVID-19 Hospitalizations and deaths will begin to rise nationally in late summer 2024 and peak in mid-December 2024 throughand mid-January 2025. Peak hospitalizations will be similar to the 2023-24 season assuming the same vaccination recommendation (all eligible individuals) and high immune escape.
- Over the course of the projection period (April 28, 2024-April 26, 2025) we project 814,000 hospitalizations (95% PI 0.4-1.2 million) and 54,000 deaths (95% PI 17,000-98,000). This presumes high immune escape and vaccination recommended to all eligible individuals (conditions similar to the 2023-24 season). Our worst case (no vaccination, high immune escape) projects 931,000 hospitalizations and 62,000 deaths, while the best case (universal vaccination, low immune escape) projects 550,000 hospitalizations and 42,000 deaths.
- Without vaccination, 52% of hospitalizations and 87% of deaths are projected to be in those 65+. This is presuming high immune escape. It is expected most deaths and hospitalizations in younger age groups would be in high-risk individuals, however these numbers were not explicitly modeled.
VACCINE IMPACT
- Vaccination of high-risk individuals is projected to prevent over 76,000 hospitalizations and 7,000 deaths. Assuming high immune escape, hospitalizations are reduced by 76,000 [8%] (95% CI: 34,000-118,000) and deaths by 7,000 [10%] (95% CI: 3,000-11,000), compared to a no vaccine recommendation scenario. The majority of this impact comes from reductions in hospitalizations and deaths in those 65+ (71,000 and 7,000, respectively).
- A recommendation for vaccination on all individuals leads to further reductions in hospitalizations and deaths, including in those 65 and older. Assuming high immune escape, a universal vaccine recommendation reduces hospitalizations by an additional 28,000 [4%] (95% CI 13,000-43,000) and deaths by an additional 2,000 [3%] (95% CI 800-3,000), compared to a high-risk recommendation. This further reduction includes reductions in hospitalizations and deaths in those 65+ from indirect vaccine protection (11,000 and 1,000, respectively).
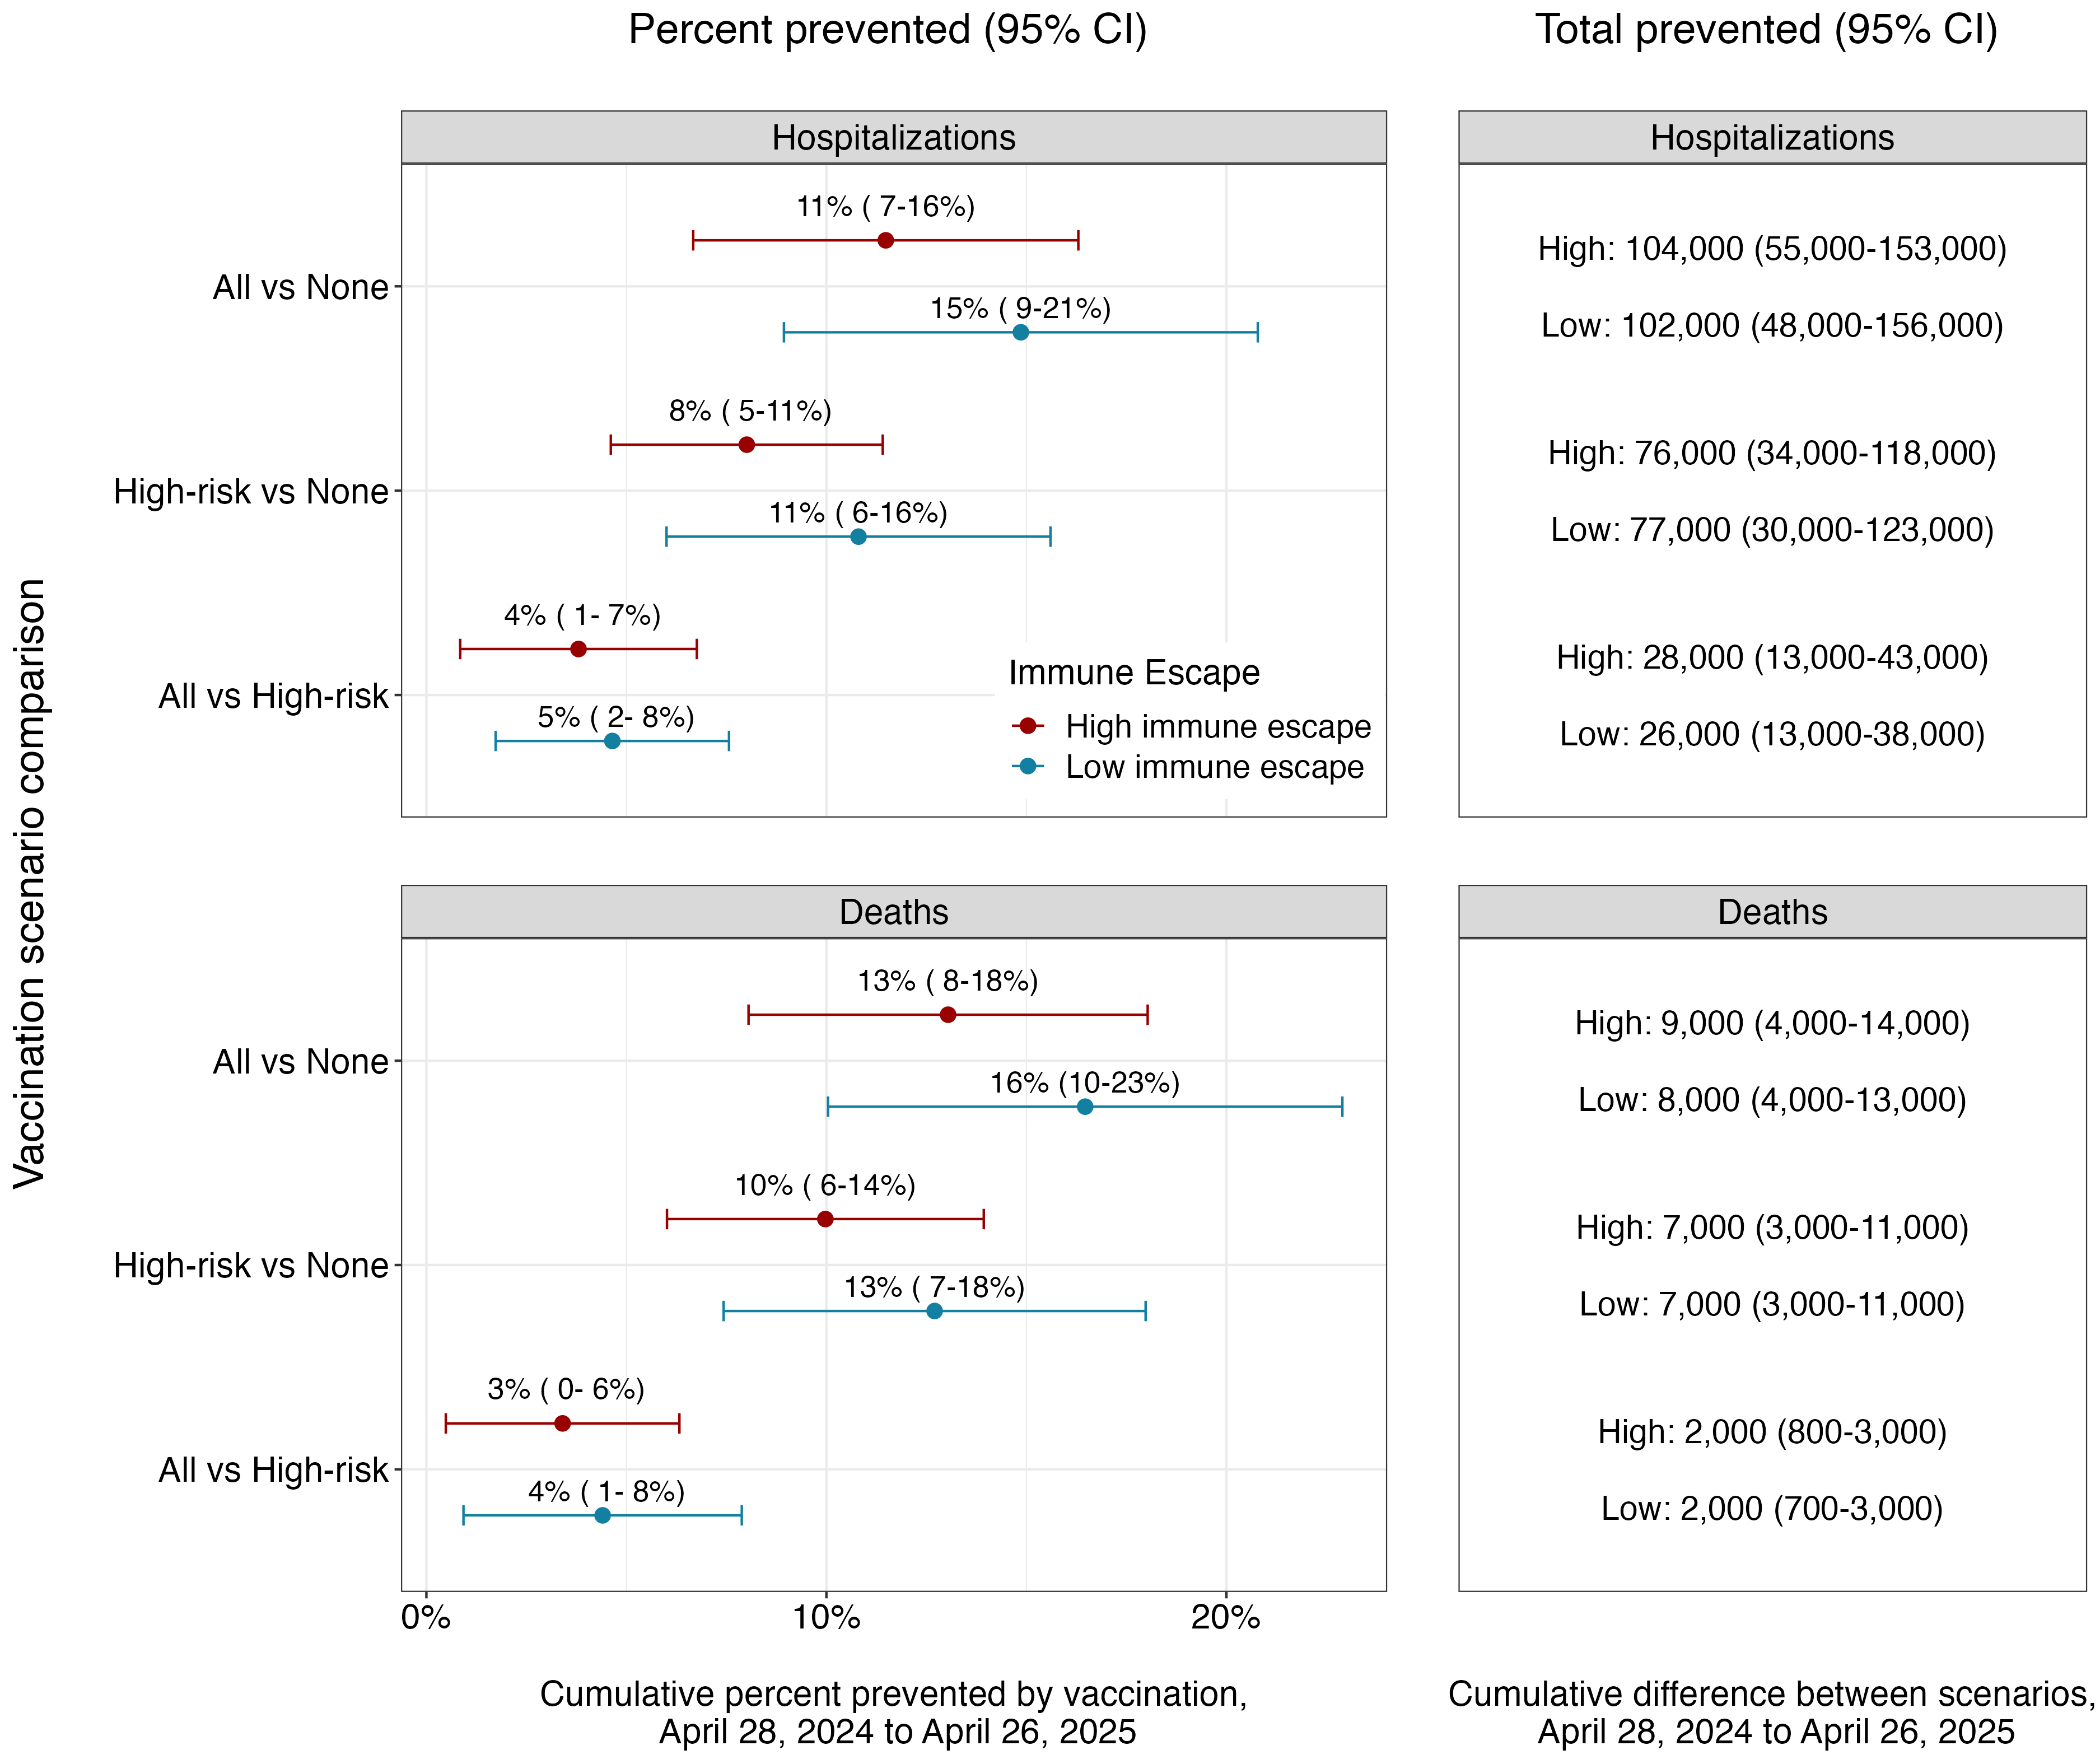
Table 1. COVID-19 Scenario Modeling Hub round 18 scenarios. More detailed scenario definitions and model characteristics can be found at https://github.com/midas-network/covid19-scenario-modeling-hub.
A Note on Scenario Modeling Hub Round 17 (June 26th, 2023)
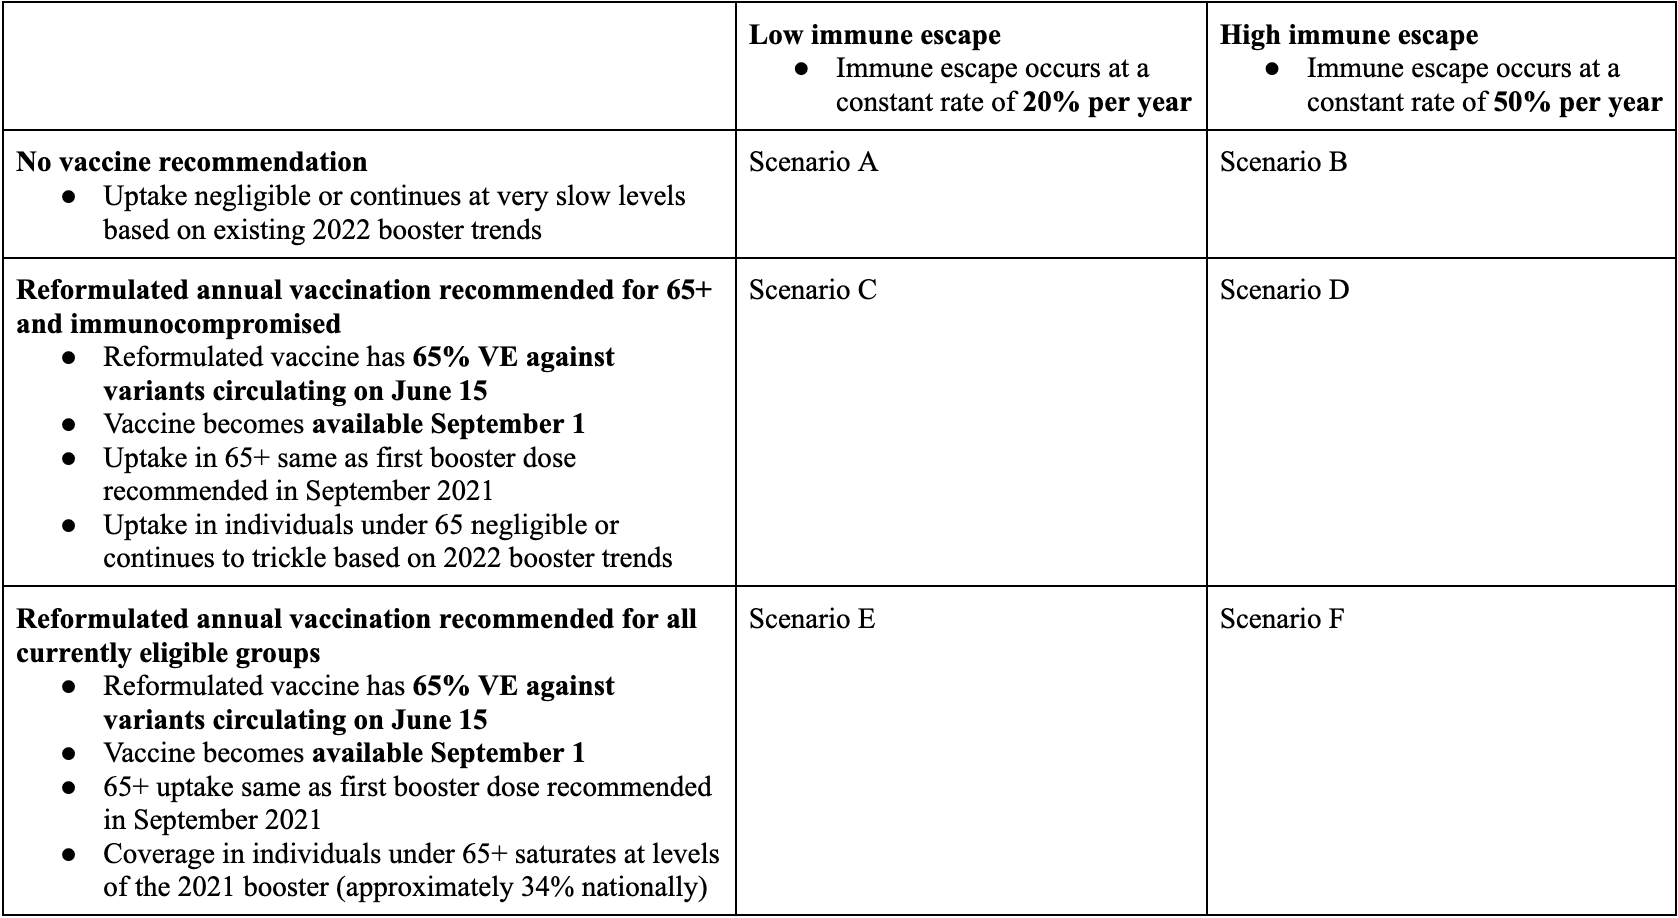
In a new round of projections, the Scenario Modeling Hub evaluated the trajectory of COVID-19 during April 16, 2023 to April 19, 2025 (104-week horizon), under 6 scenarios about the annual uptake of reformulated boosters (minimal uptake, uptake in 65+ corresponding to 2021 booster levels, or uptake in all ages corresponding to 2021 levels) and extent of immune escape of circulating variants (50% vs 20% annually). Eight teams contributed both national and state-specific projections, while one team submitted results for a subset of states.
Our main findings include:
- Based on the national ensemble, the main period of COVID19 activity is expected to occur in late fall and early winter over the next 2 years, with median peak incidence between November and mid January. Lowest incidences are projected to occur in August of each year.
- For the range of scenarios considered, weekly hospitalizations and deaths are likely to stay within last year’s range, and unlikely to hit Delta or Omicron peaks. Further, weekly hospitalizations are likely to remain at low or medium community transmission levels and unlikely to reach high transmission levels (>20 weekly hospitalizations per 100,000), as defined by the CDC.
- In the most pessimistic scenario (no booster, high immune escape) we project 2.1 million hospitalizations (1.4 million-4.5 million) and 209,000 deaths (138,000-479,000) over the 2-year projection period, with 839,000 hospitalizations and 87,000 deaths in the first cold month season (Sep 2023-Apr 2024). In the most optimistic scenario (boosters for all ages, low immune escape) this reduces to 1.4 million hospitalizations (907,000-2 million) and 122,000 deaths (55,000-201,000) over 2 years, with 484,000 hospitalizations and 45,000 deaths occurring in the first cold month season. The Sep 2024-Apr 2025 season is projected to be slightly (5-22%) more severe than the coming season.
- Vaccination of 65+ and of all ages would significantly reduce disease burden compared to no vaccination scenarios, irrespective of immune escape assumptions. Under low and high immune escape scenarios vaccination of 65+ reduces hospitalizations by 11% and 9%, and reduces deaths by 16% and 13%; targeting all ages reduces hospitalizations by 23% and 17%, and deaths by 26% and 20%, compared to no vaccination. In absolute numbers vaccinating 65+ would result in 202,000 (114,000-290,000) fewer hospitalizations and 28,000 (13,000-44,000) fewer deaths nationally over the two year projection period in low immune escape scenarios, compared to no vaccination. Expanding vaccination to all ages increases these reductions to 430,000 (264,000-598,000) hospitalizations and 49,000 (29,000-69,000) deaths under low immune escape assumptions. Reductions in numbers of deaths and hospitalizations are similar, but slightly higher, in high immune escape scenarios.
- A few caveats are worth
noting:
- We assumed the VE of reformulated boosters would be 65% against symptomatic disease at the time of reformulation in June of each year. The effectiveness of reformulated boosters against existing and new variants remains unclear, as does the pace of waning after multiple booster shots and repeat infections.
- We assumed continuous immune escape rather than discrete variants, mirroring observations of evolutionary changes in the last year. We did not consider the impact of a significant new variant that would have accumulated a large amount of antigenic changes over a very short period, nor increase in transmissibility (akin to Delta or Omicron variants). We also assumed that the intrinsic severity (i.e. severity in naive populations) of future circulating strains would remain similar to that of the Omicron lineages.
- There is considerable heterogeneity between states and between individual models. In particular, in the high immune escape scenarios some models project a second smaller peak in late Spring.
- We switched calibration of death data to a different dataset (NCHS) following the end of the CSSE surveillance system, which may introduce small differences when comparing Round 17 death projections with those of past rounds. Further, we no longer project case trajectories. Hospitalizations from HHS protect continue to be a stable outcome, although reporting to this system remains unclear over the full 2 year projection period.
- These are results based on projections from 9 teams, of which 8 provided national estimates for hospitalizations and 7 provided national estimates for deaths. Results will be updated should projections from additional models become available.
Figures. Estimates of burden averted by increasing target age groups for vaccination (pooled national estimates across models for the full projection period
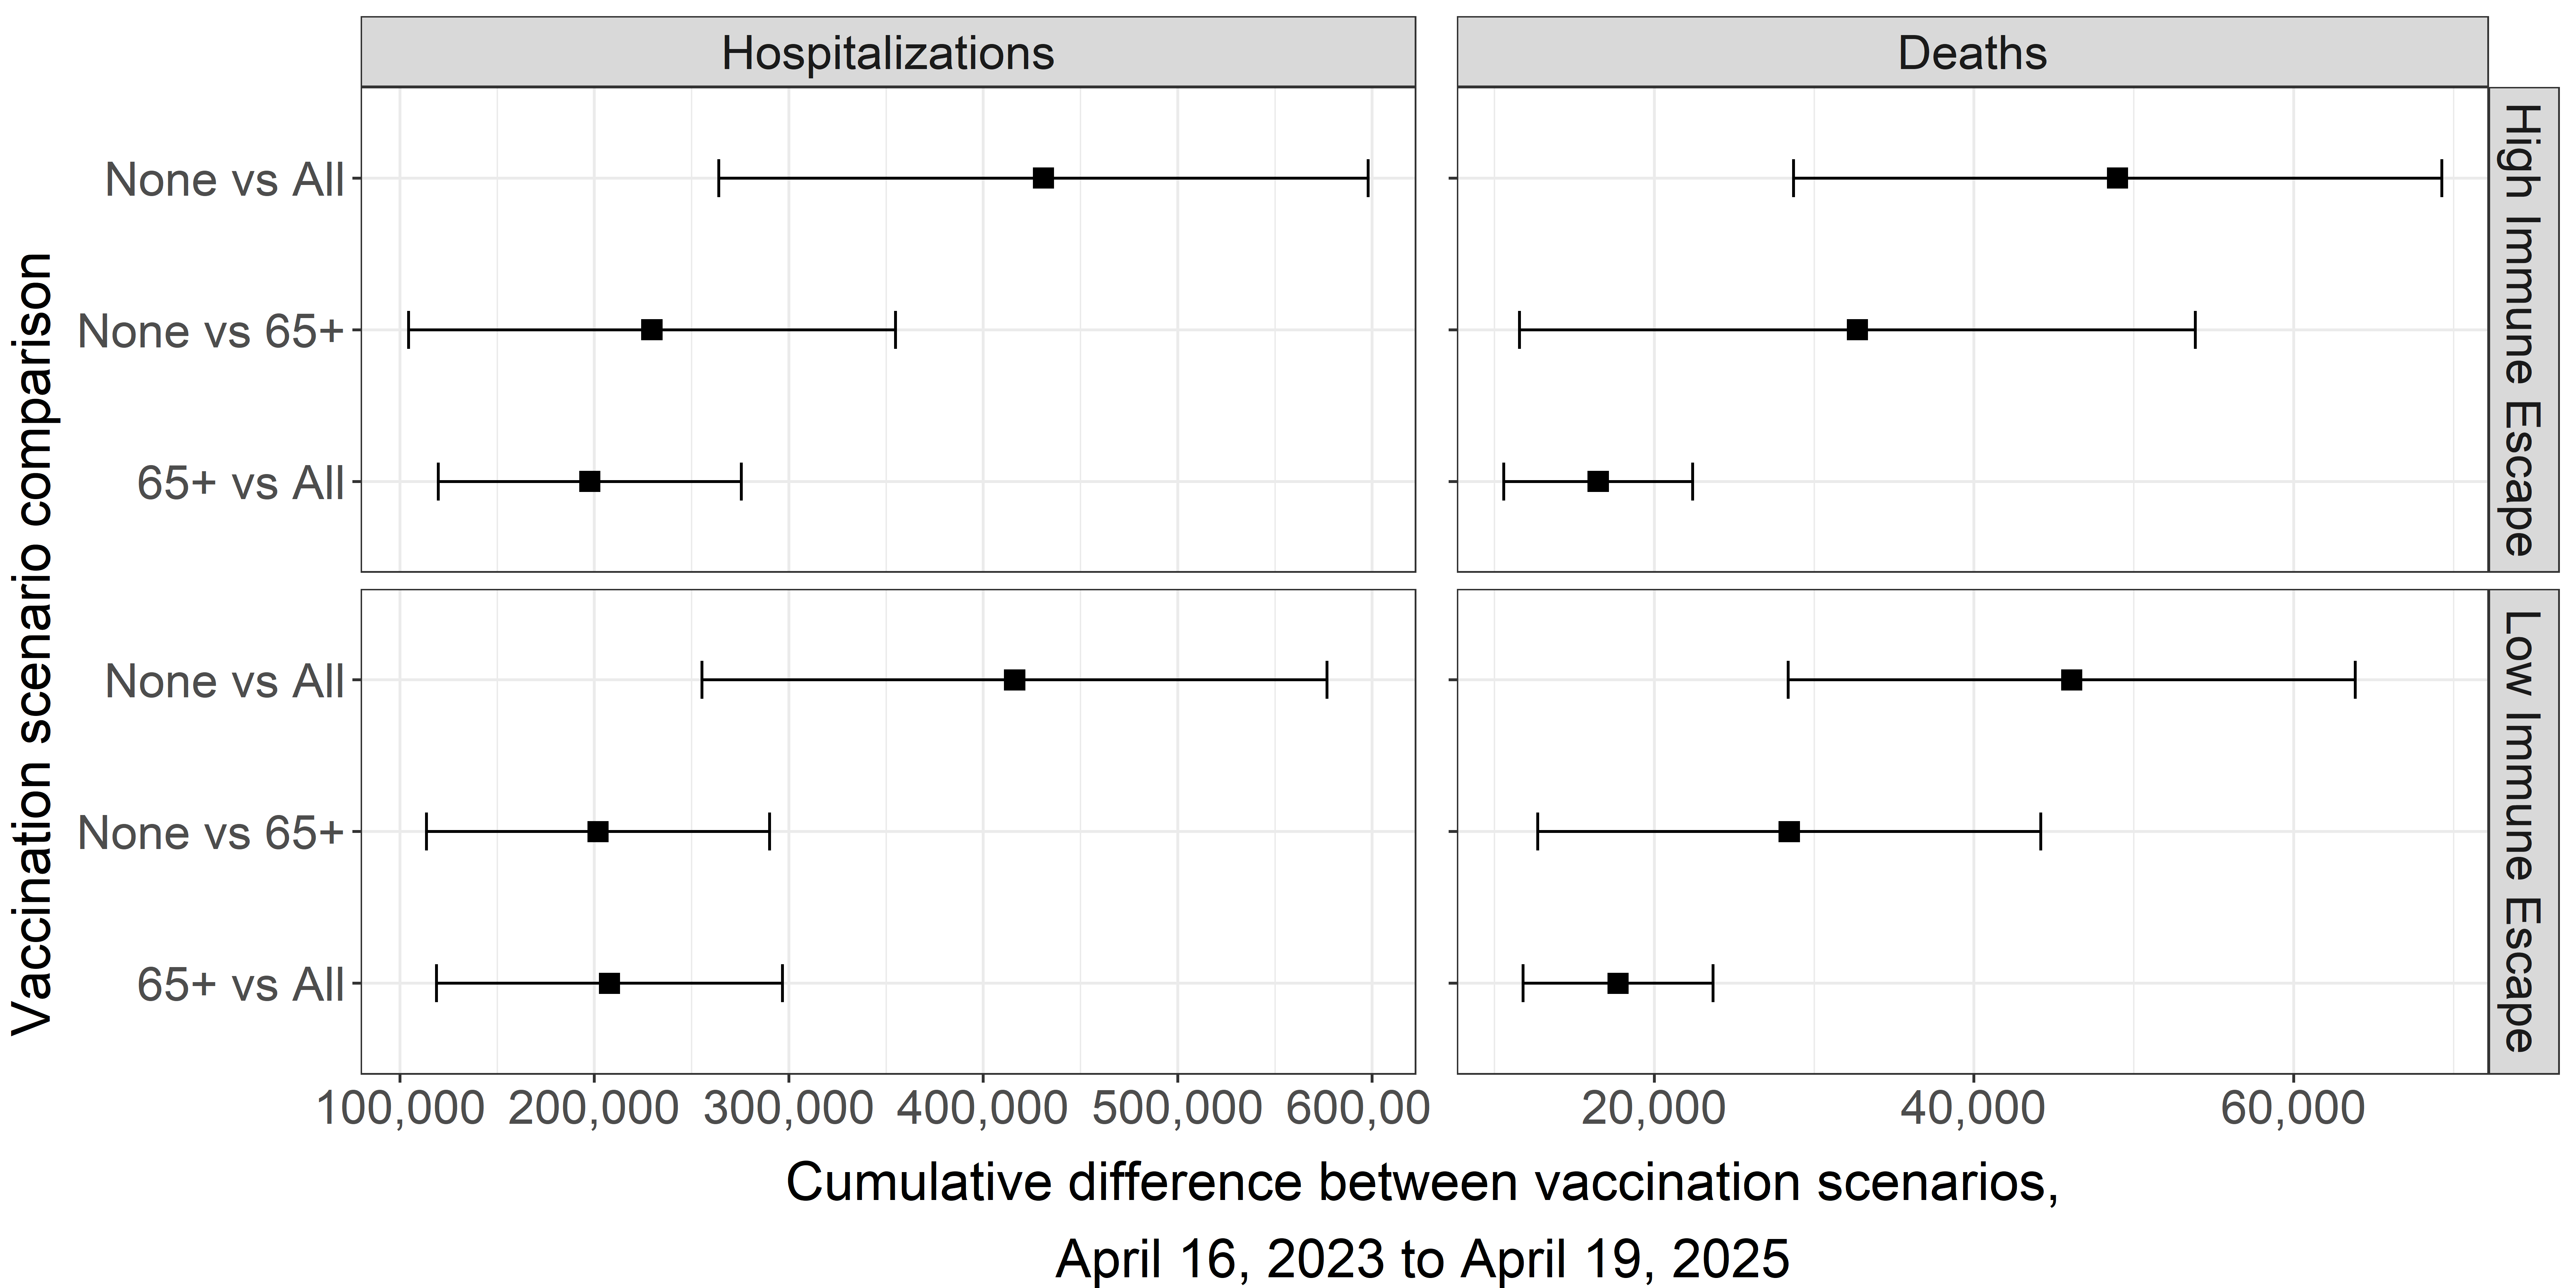
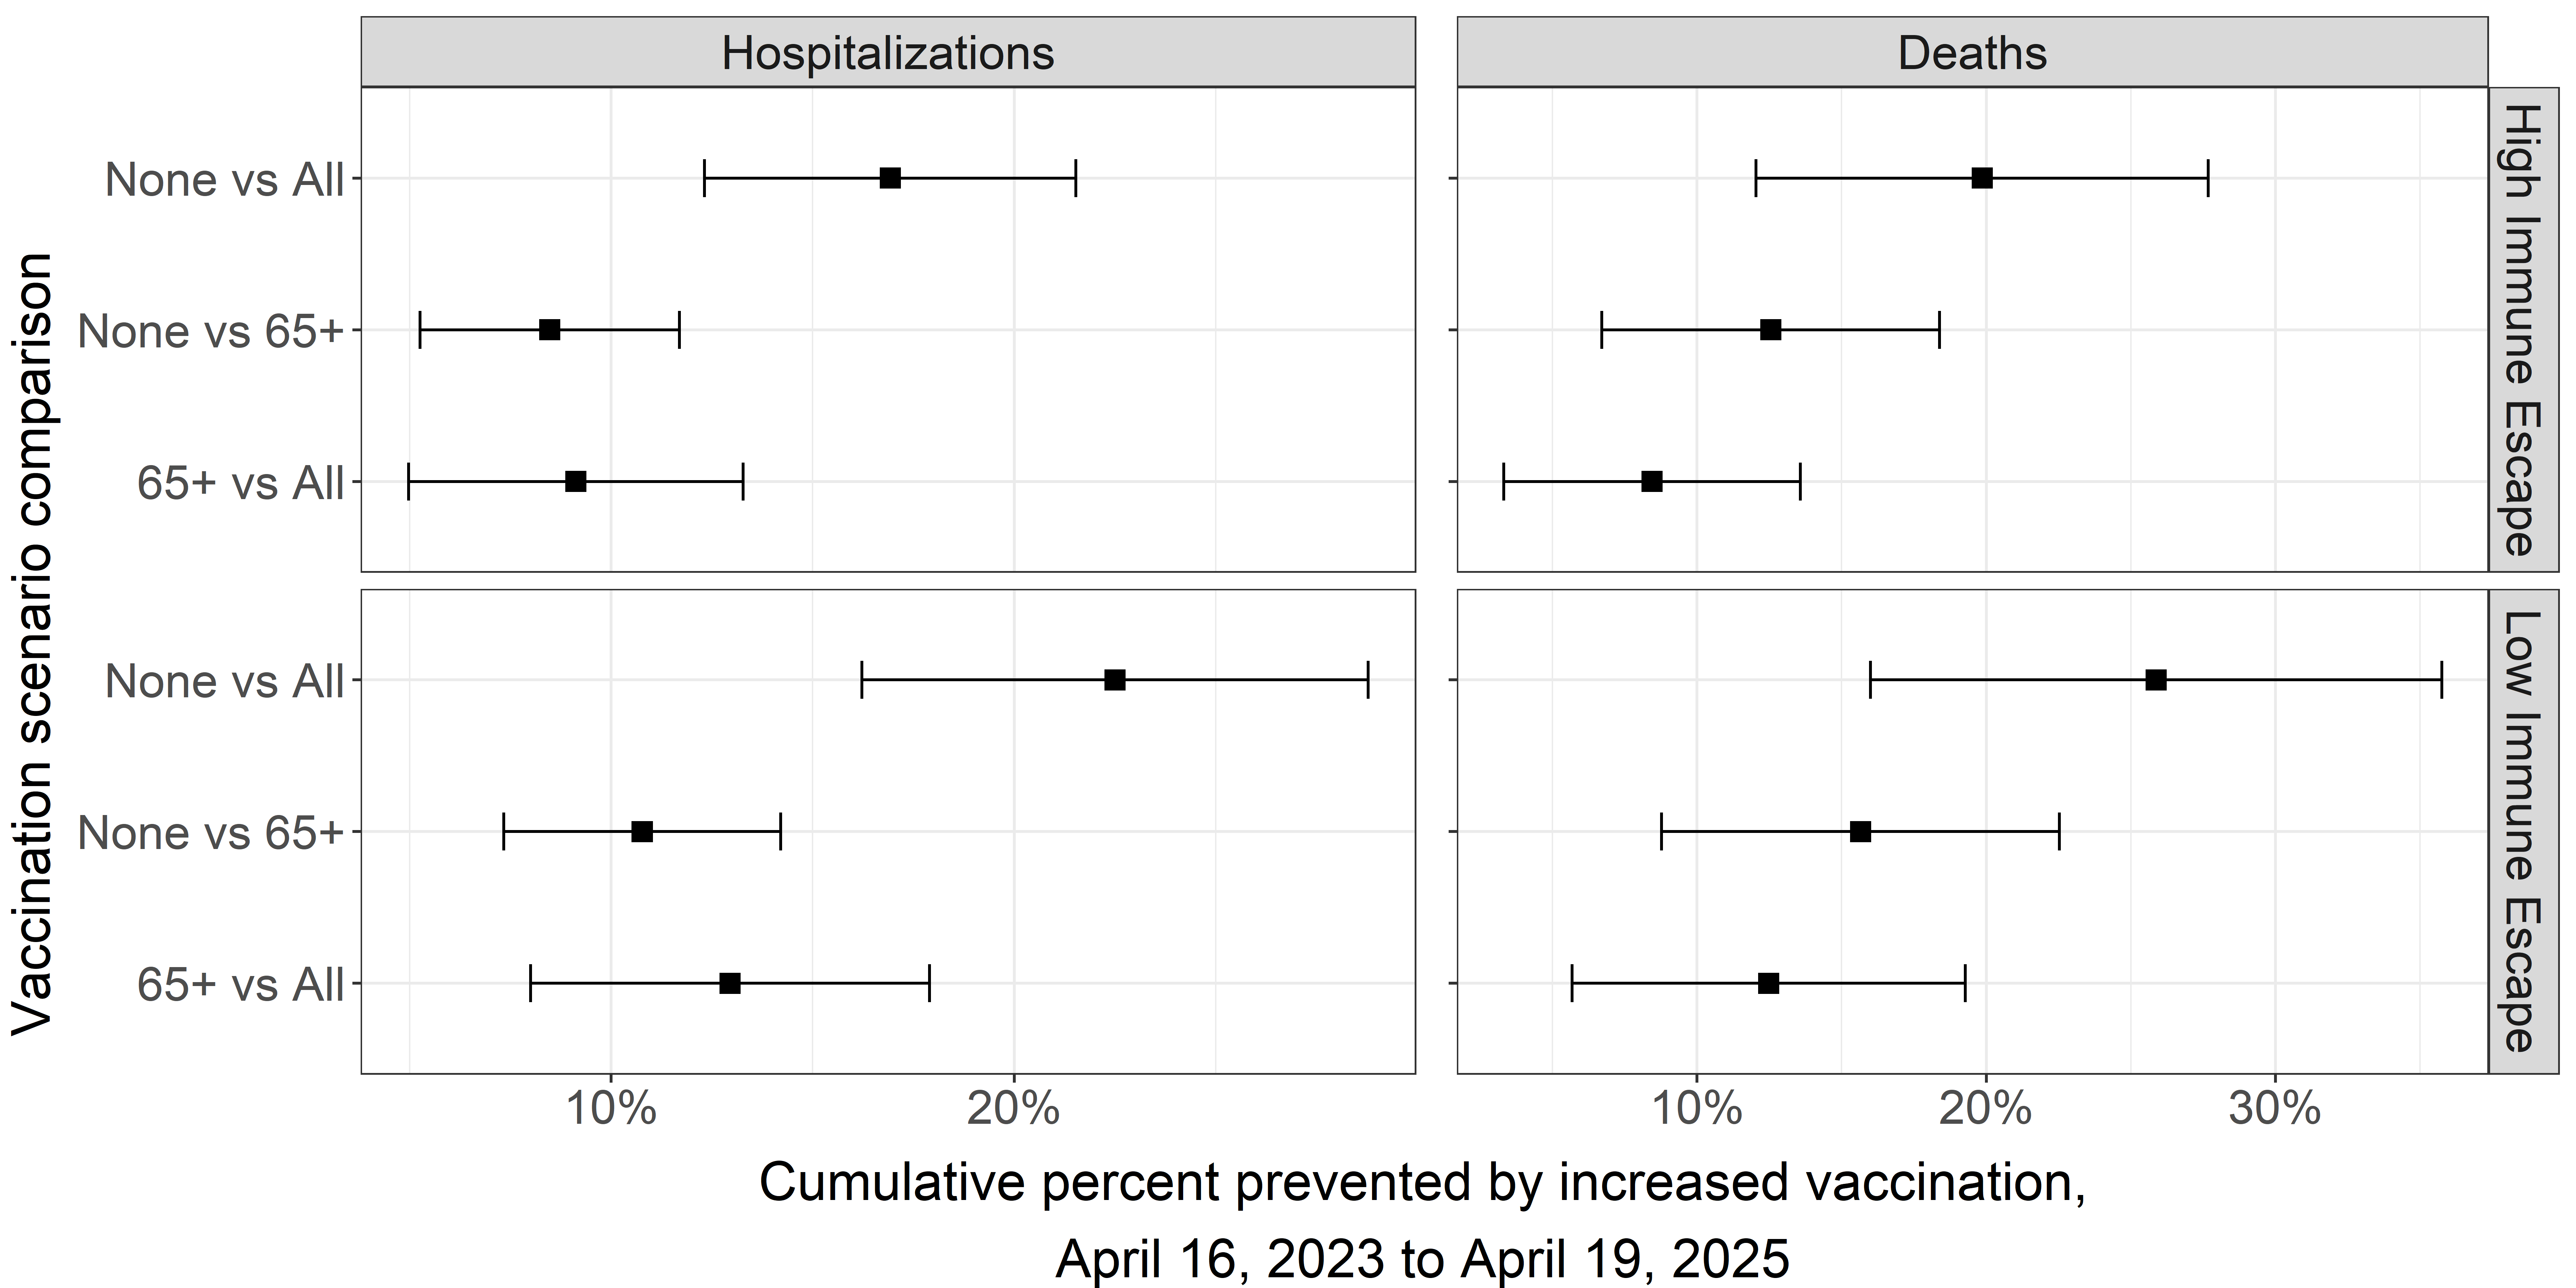
Table 1. COVID-19 Scenario Modeling Hub round 17 scenarios. More detailed scenario definitions and model characteristics can be found at https://github.com/midas-network/covid19-scenario-modeling-hub.
A Note on Scenario Modeling Hub Round 16 (November 28, 2022)
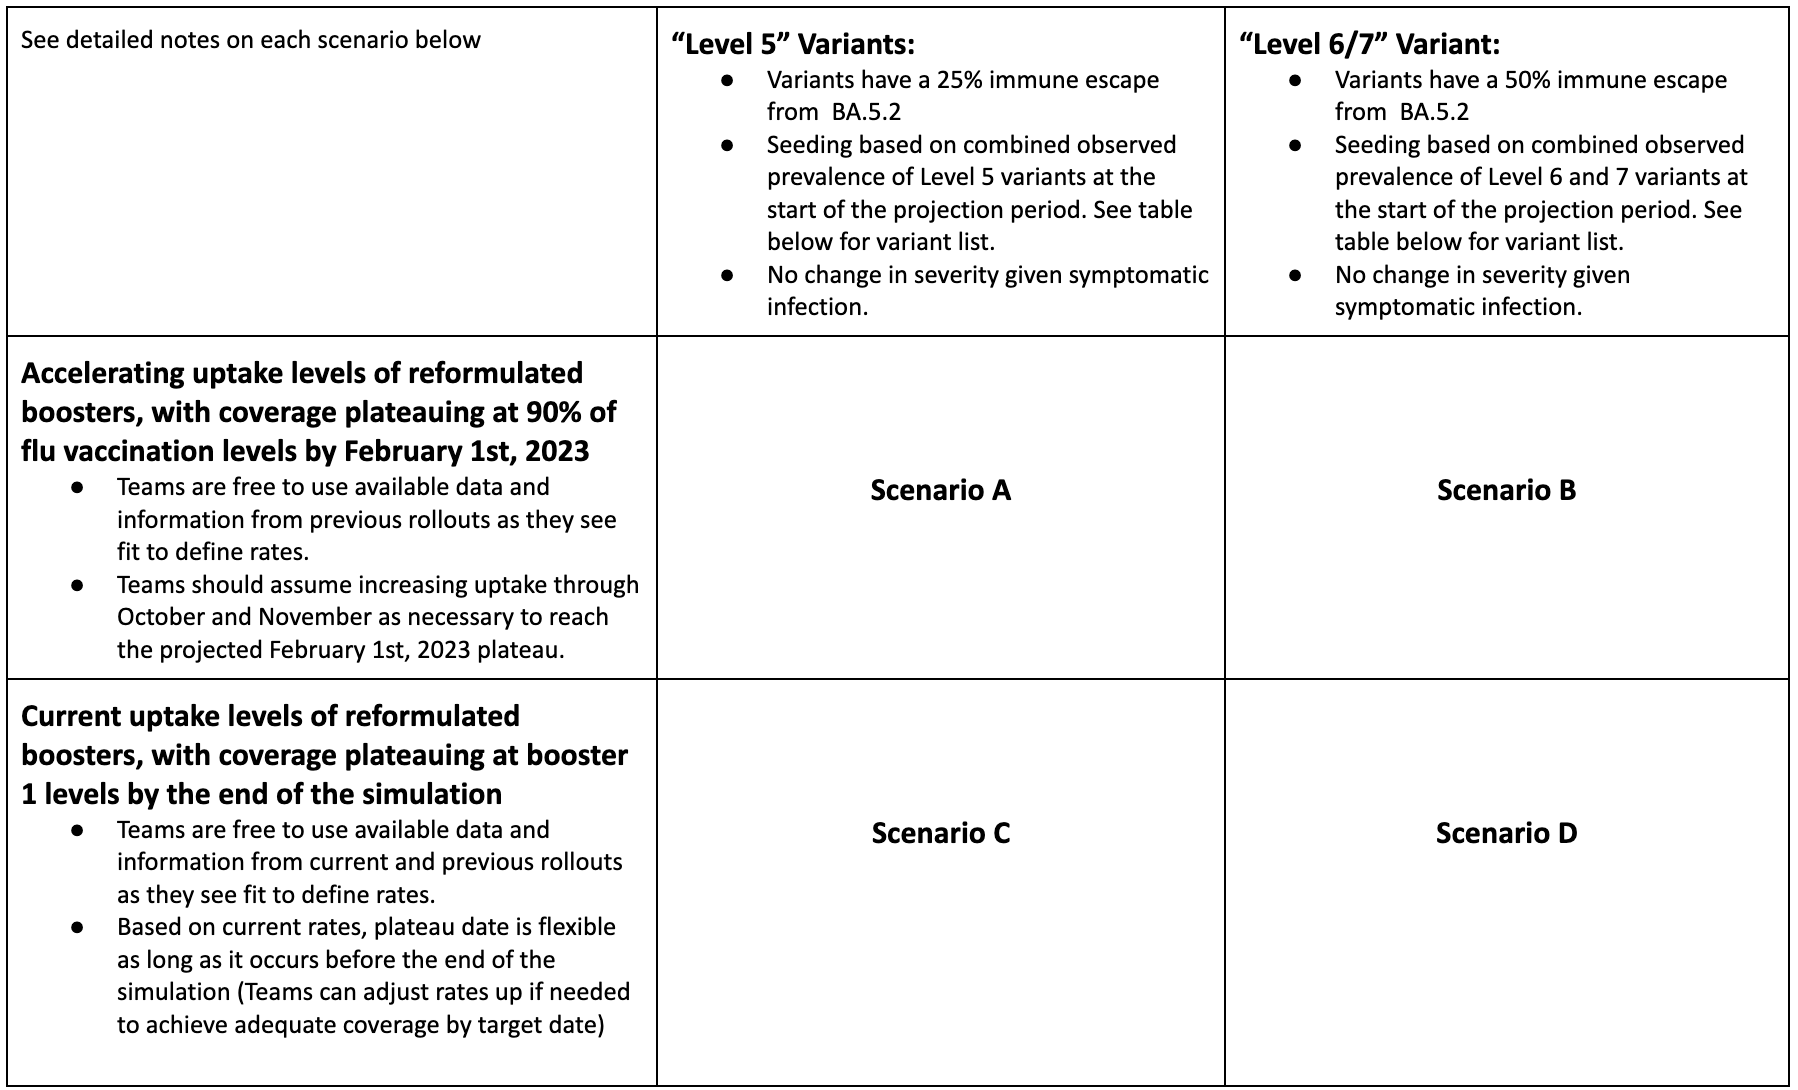
In a new round of projections, the Scenario Modeling Hub evaluated the trajectory of COVID-19 during October 30, 2022 to April 29, 2023 (26-weeks), under different assumptions about the uptake of bivalent boosters and extent of immune escape of circulating variants compared to the previously dominant BA.5 variant. Six teams contributed both national and state-specific projections.
Our main findings include:
- In scenarios considering moderate immune escape variants (scenarios A and C, corresponding to a 25% immune escape to BA.5) hospitalizations are projected to remain constant or rise moderately this winter, though the possibility of moderate resurgences still exists.
- The rise in hospitalizations is more pronounced in high immune escape variant scenarios (scenarios B and D, corresponding to a 50% immune escape). In these scenarios, hospitalizations would peak in December 2022 and could reach or exceed the level of the peak of the Delta wave from summer 2021.
- High booster uptake (similar to the uptake of the flu vaccine) would reduce cumulative hospitalizations by 26-31% and deaths by 32-34% on average over the projection period. This is compared to a lower booster coverage, which would follow the first booster campaign in winter 2021-22. Current uptake of boosters appears to be closer to our more pessimistic scenario.
- Weekly incident deaths are projected to follow the same general patterns as hospitalizations. In the worst case scenario D (low booster coverage and high immune escape), weekly deaths are likely to remain substantially below the Omicron peak (Dec 2021 - Jan 2022).
- In the most optimistic scenario (high booster coverage, moderate immune escape), we project 555,000 cumulative hospitalizations (95% PI, 97,000-1,195,000) over the 26-week projection period, and 47,000 cumulative deaths (95% PI, 0-221,000). In the most pessimistic scenario (low booster coverage, high immune escape), we project 959,000 cumulative hospitalizations (95% PI, 179,000-3,382,000) and 128,000 deaths (95% PI, 26,000-241,000).
- Based on recent bivalent vaccine uptake and effectiveness information, the more pessimistic vaccination scenarios (C and D) appear to be the most plausible.
- Immune escape scenarios may be best interpreted as bounding, with high escape scenarios (B and D) currently appearing less likely based on recent trajectories.
- A few caveats are worth
noting:
- We assumed the VE of reformulated boosters would be 80% against symptomatic disease with BA.4/5, immediately after vaccination. The effectiveness of reformulated boosters against existing and new variants remains unclear, as does the pace of waning after multiple booster shots and repeat infections.
- Multiple variants co-circulate, which makes it difficult to project the epidemiological impact of future dominant variants.
- There is considerable heterogeneity in the trajectories of individual models.
- Issues with case ascertainment and delays in death reporting make model calibration difficult for these outcomes. Hospitalizations continue to be a stable outcome.
Table 1. COVID-19 Scenario Modeling Hub round 16 scenarios. More detailed scenario definitions and model characteristics can be found at https://github.com/midas-network/covid19-scenario-modeling-hub.
Technical report: The uncertain burden of COVID-19 and influenza in the upcoming flu season (October 25, 2022)
The technical report can be downloaded in a pdf format with supplemental plots.
Summary
As the 2022-2023 flu season approaches, there is substantial concern as to the potential for a “twindemic” from the combined influenza season and a new wave of SARS-CoV-2. This heightened concern comes in the context of multiple emerging SARS-CoV-2 variants of concern and the potential for a large influenza season due to limited transmission during the past two seasons. Of particular concern is the potential burden to healthcare facilities, with excessive hospitalizations straining health systems. To better understand what this burden might look like, we combined the ensemble estimates of hospitalizations from the latest rounds of the COVID-19 Scenario Modeling Hub (Round 15) and the Flu Scenario Modeling Hub (Round 1). As of October 25, 2022, all scenarios of COVID-19 Round 15 and the pessimistic immunity scenarios of Flu Round 1 are tracking well with observed hospitalizations from each virus.
Results
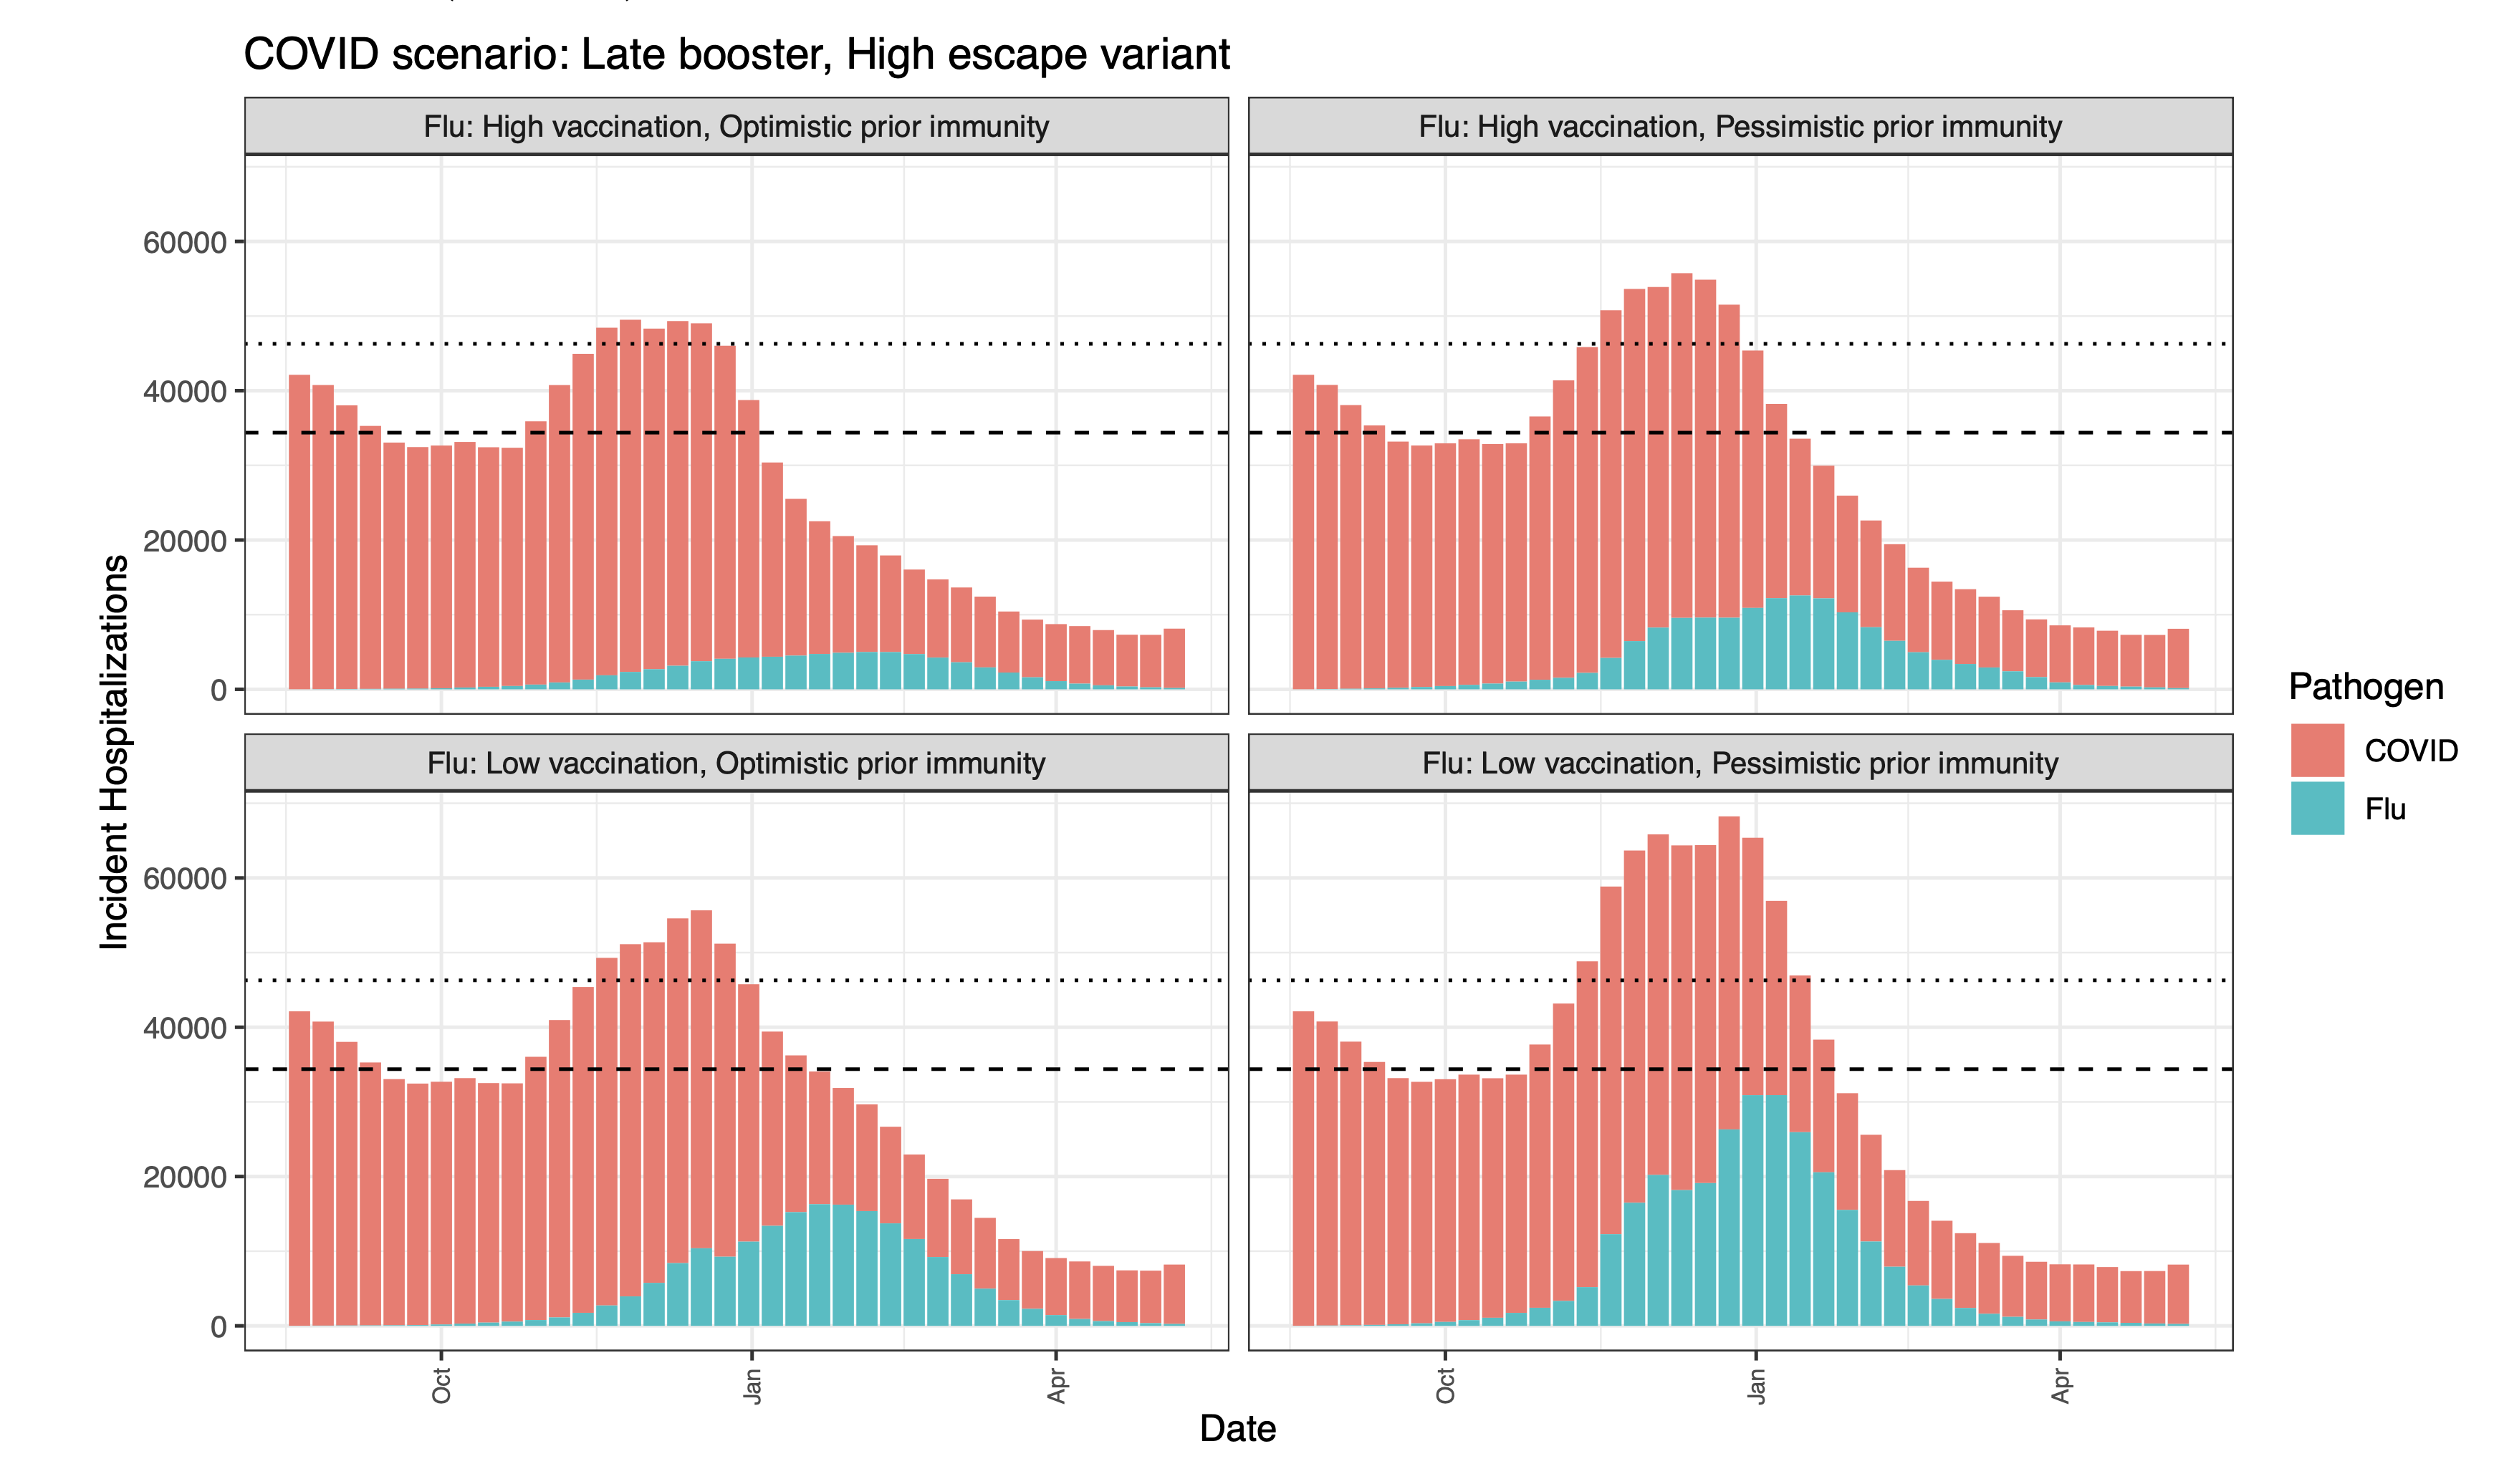
Combining COVID-19 and influenza hospitalization projections, we find that while there is substantial variability among the combinations of the various scenarios, in each combination, we expect to see a substantial burden on the healthcare system. In particular, with the most pessimistic COVID-19 scenario (i.e., a new SARS-CoV-2 variant with late boosters) combined with all scenarios of influenza, hospitalizations are projected to exceed the highest levels of weekly incident hospitalizations observed since the first Omicron surge (n=46,000 in July 2022). In the most pessimistic combination of scenarios, we project 68,000 peak hospitalizations (median ensemble estimates).
In scenarios assuming pessimistic prior immunity to influenza driven by limited transmission during the COVID-19 pandemics, we project large and early influenza seasons. In the most pessimistic influenza scenario in particular, which assumes low 2022-23 vaccination protection, influenza hospitalizations are projected to peak early, during the week of December 17 (50% PI, November 26-January 7), and in the most optimistic scenario where immunity is the highest of all scenarios considered, the influenza ensemble peaks in the week of January 14 (50% PI, December 3-January 28). Given our assumptions about circulation of new COVID-19 variants, a COVID-19 surge is projected to precede an influenza surge. A combined hospital load is projected to peak in December-January.
Caveats and limitations
These projections were produced by combining separate multimodel ensemble projections of COVID-19 and influenza. We do not account for any interaction between COVID-19 and influenza, which could include behavioral or immunological interactions that might modify the impacts of one or both of these viruses. Additionally, these projections were produced without empirical data on either influenza for the 2022-2023 season or on the currently emerging SARS-CoV-2 variants. Despite this, they are tracking well with observed hospitalizations from each virus.
Methods
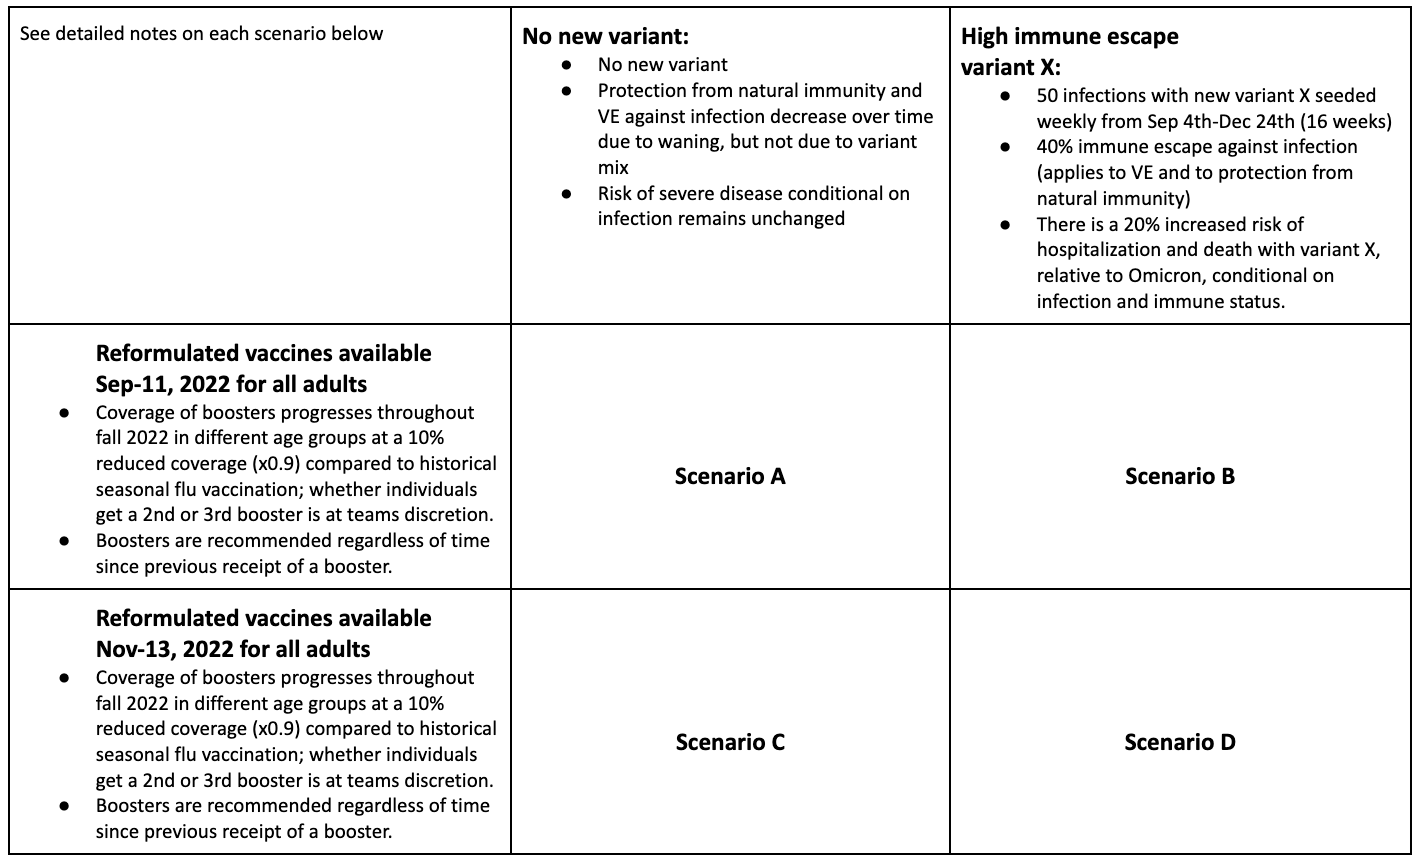
We combined the most recent rounds of COVID-19 (Round 15) and influenza (Round 1) projections. The projection period for COVID-19 Round 15 was July 31, 2022 to May 6, 2023, and the scenario axes considered were the timing of the updated bivalent boosters (available from September 11 in the optimistic scenario versus November 13 in the pessimistic) and the emergence of a new variant of concern (no new variant beyond BA.5 versus an immune escape variant with increased severity emerging in Sept 2022). The projection period for Flu Round 1 was August 14, 2022 to June 3, 2023, and the scenario axes addressed vaccination protection (high or low) and assumptions around prior flu immunity (optimistic or pessimistic, with optimistic representing a typical influenza season and pessimistic being driven by 2 years of limited influenza transmission). The overlapping projection period for the two rounds covered August 14, 2022 to May 6, 2023.
Seven teams contributed scenario projections for COVID-19 Round 15, and ten teams for flu Round 1 scenarios. Ensembles of these scenarios were obtained, and the medians of these ensembles were combined to obtain an aggregate number of incident hospitalizations. We assumed independence of COVID-19 and flu, with no interactions between the pathogens or diseases, or the behaviors toward them.
Ensemble median projections - incident hospitalizations
The dashed horizontal line is the prior peak incident hospitalizations and deaths for influenza, from seasons 2012-13 to 2019-20. These seasons are taken from FluSurv-NET (which is used as a proxy for national hospitalizations). This is from the 2017-18 season. The dotted horizontal line is the highest national COVID peak since the Omicron surge (~46,000).
Round Scenario Specifications
Table 1. Flu Scenario Modeling Hub round 1 scenarios. More detailed scenario definitions and model characteristics can be found at https://github.com/midas-network/flu-scenario-modeling-hub.
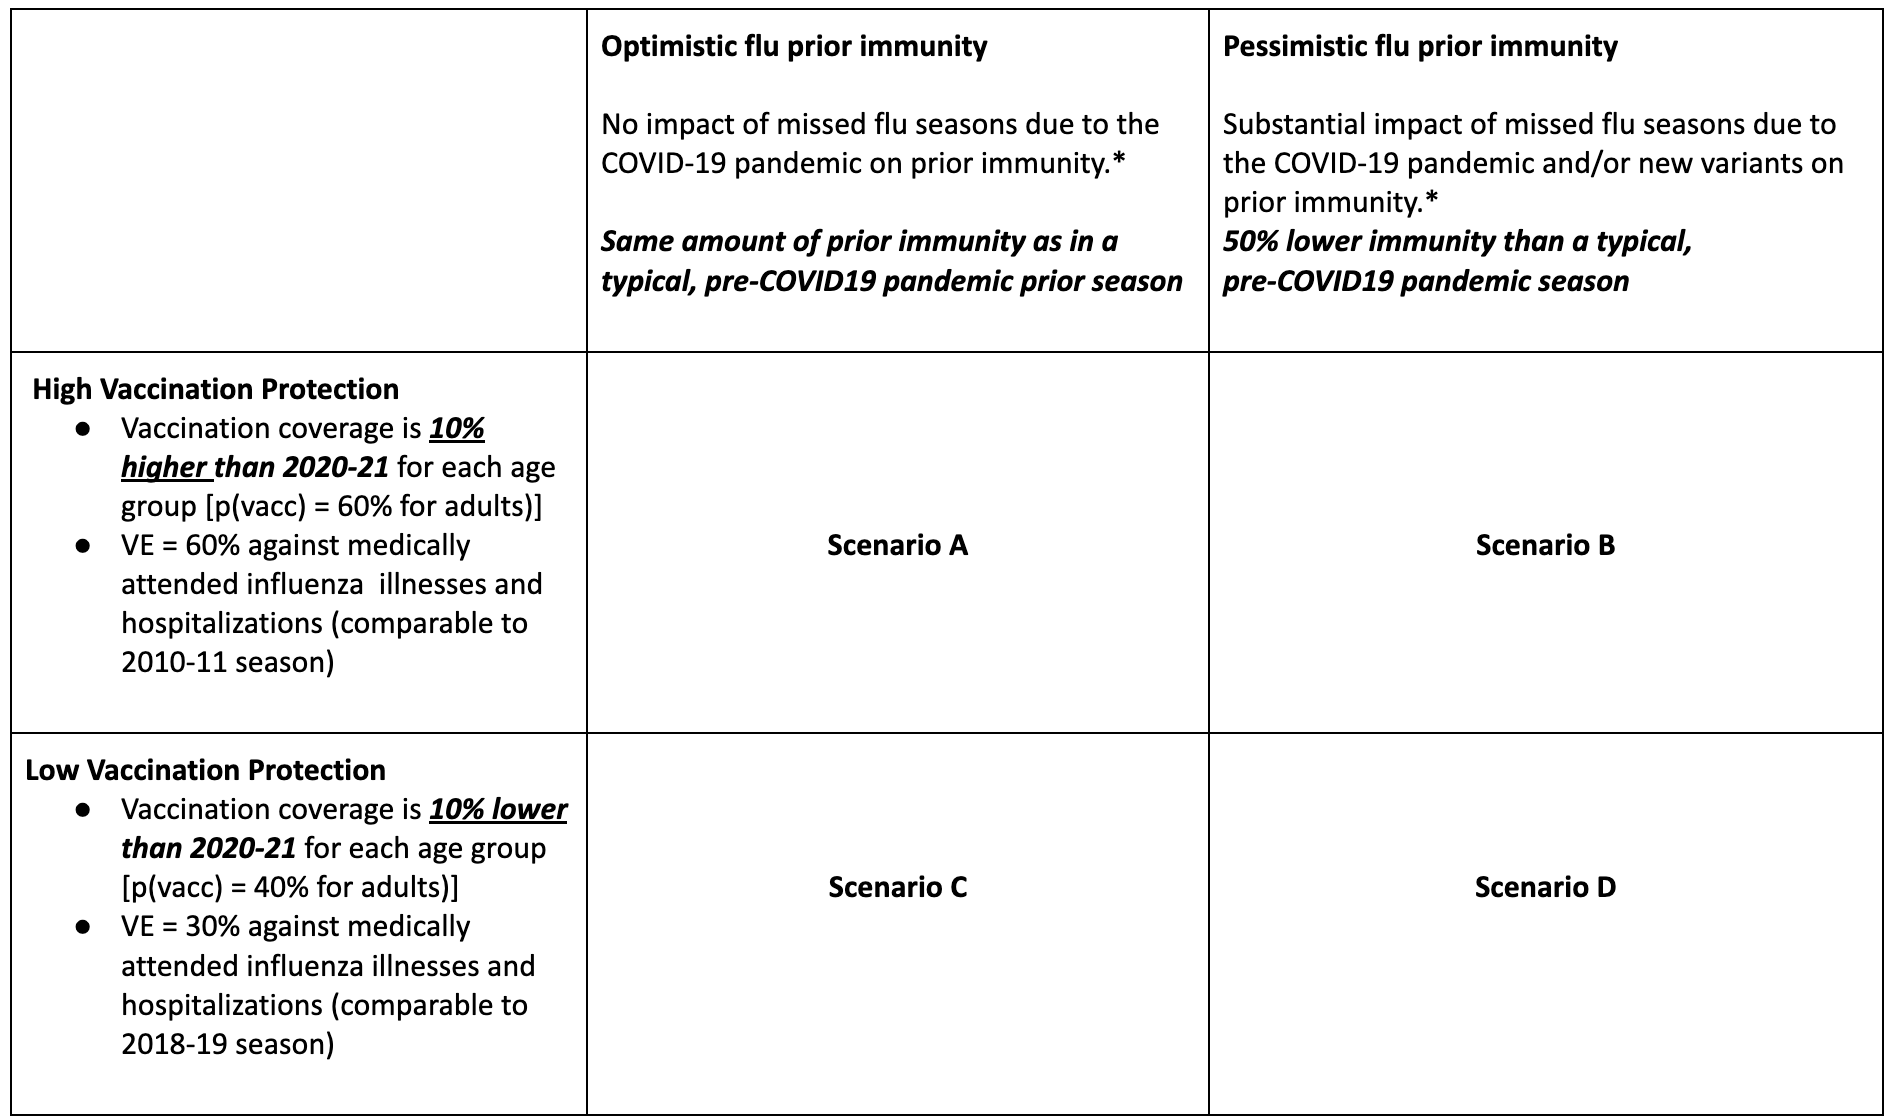
Table 2. COVID-19 Scenario Modeling Hub round 15 scenarios. More detailed scenario definitions and model characteristics can be found at https://github.com/midas-network/covid19-scenario-modeling-hub.
A Note on Scenario Modeling Hub Round 15 (August 16, 2022)
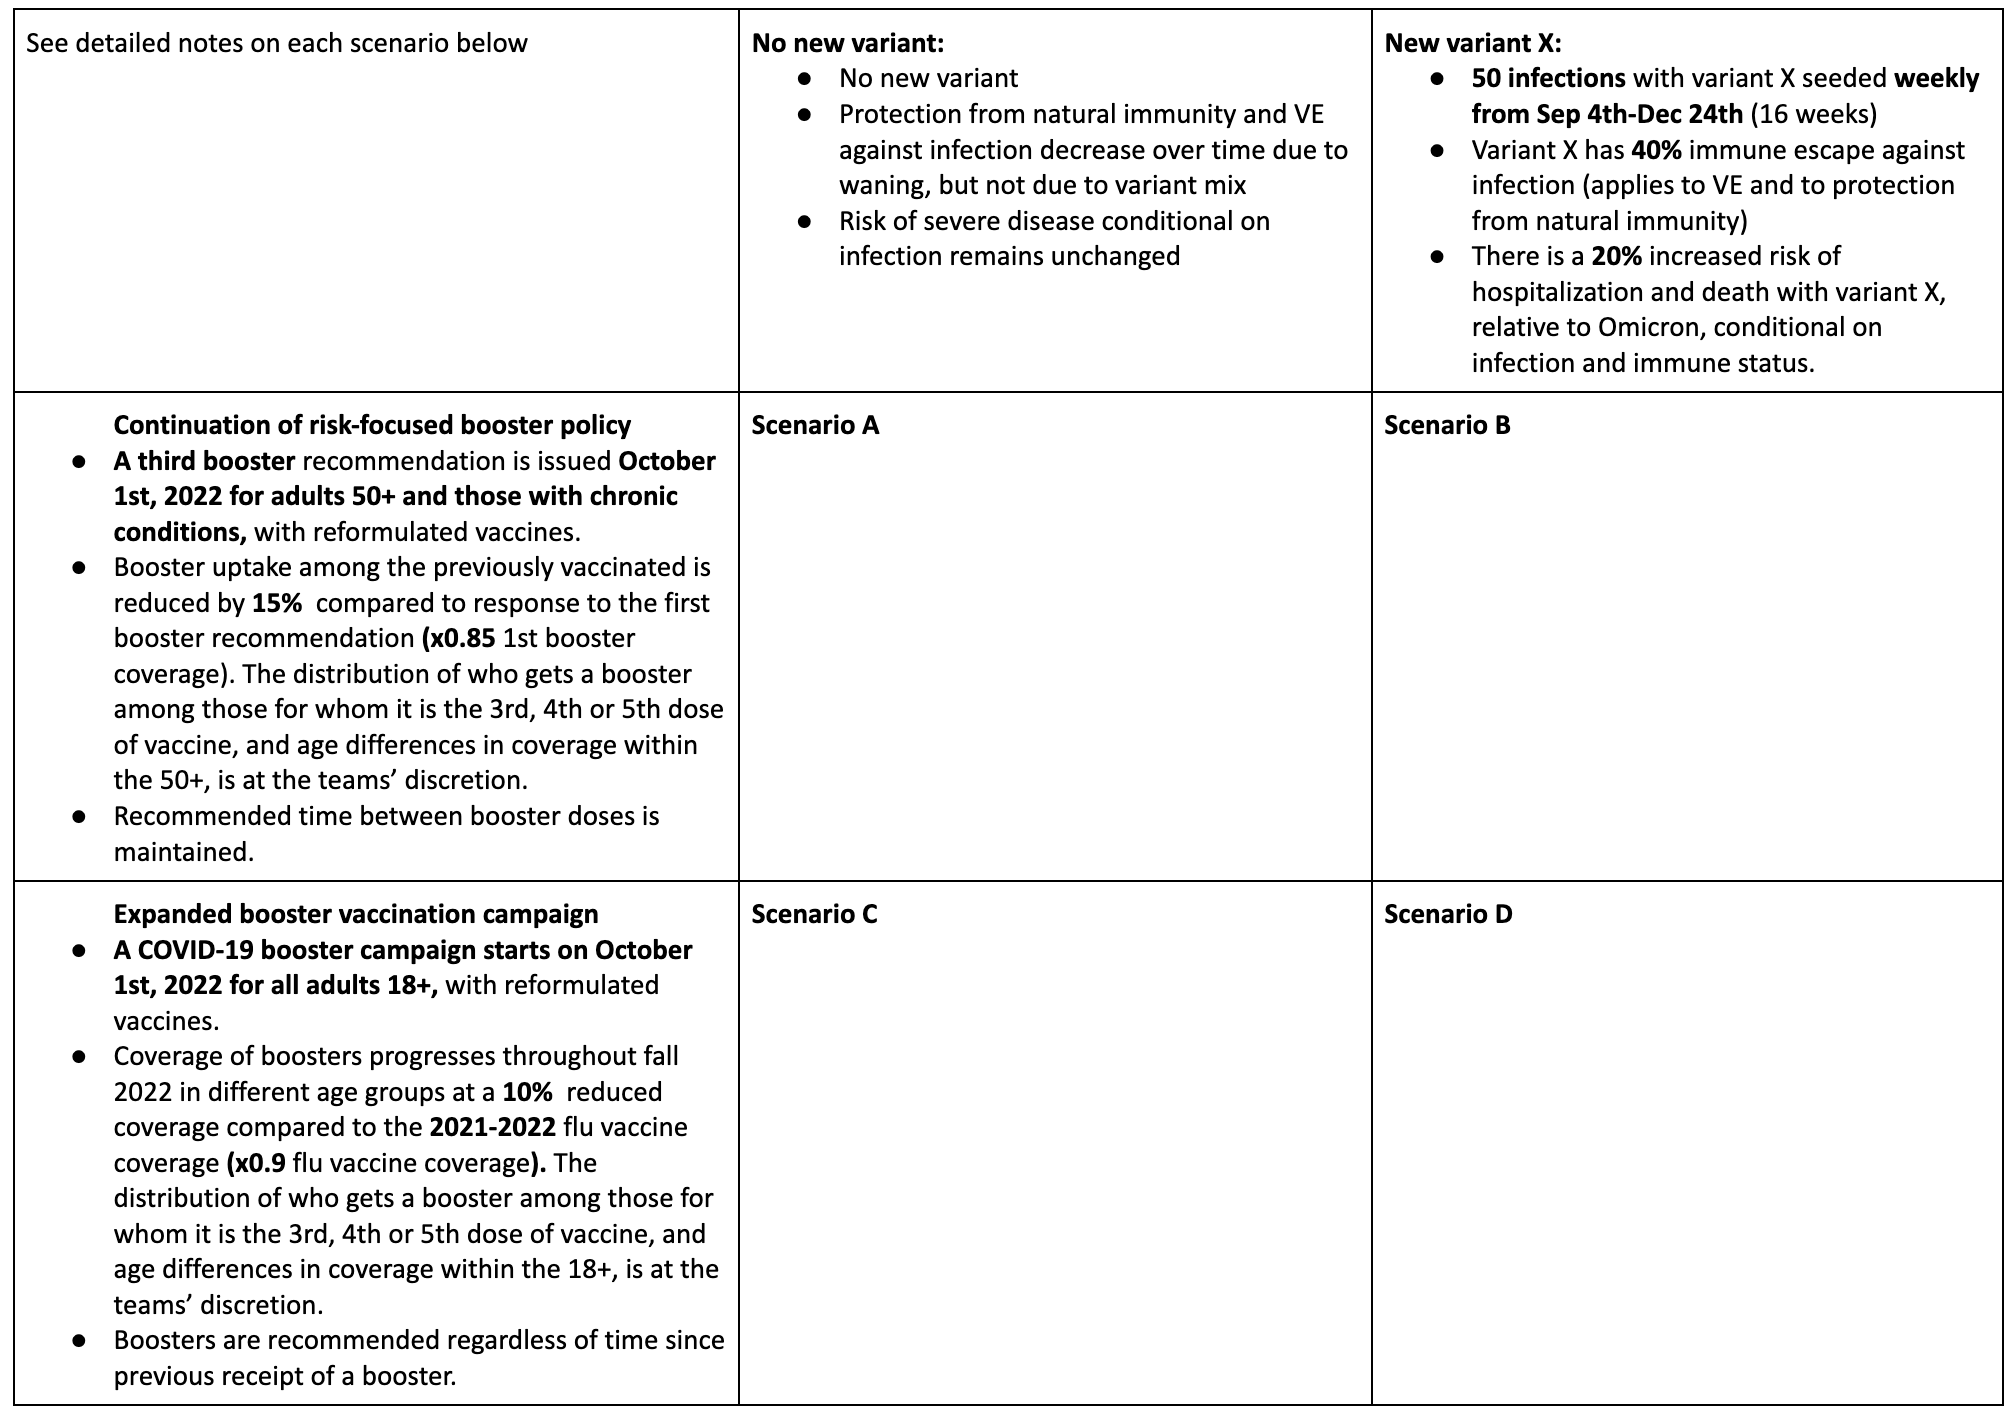
In a new round of projections, the Scenario Modeling Hub evaluated the trajectory of COVID-19 during Aug 2022-May 2023, under different assumptions about the timing of the fall 2022 booster campaign and the emergence of a hypothetical new variant in fall 2022.
Our main findings include:
- In the absence of a new variant, and with a late vaccination campaign, hospitalizations are projected to remain stable and gradually decline until the end of the year.
- Early distribution of reformulated boosters starting in mid-September is expected to decrease hospitalizations in early fall. Over the entire projection period, absent a new variant, early boosters are projected to prevent 2.4M (95% CI 0.8-4.8) cases, 137,000 (95% CI 21,000-251,000) hospitalizations and 9,700 (95% CI 500-19,000) deaths.
- Not all models project a rebound with the arrival of a hypothetical new variant in the fall, so that there is large uncertainty in ensemble projections. If it occurs, a rebound would most likely peak near the end of the year.
- In the most pessimistic scenario evaluated in this round, with a new variant and late boosters, we project 1.3M cumulative hospitalizations (95% PI 0.4-2.7M) and 181,000 cumulative deaths (95% PI 23,000-346,000) to occur over the 9 month projection period. In the most optimistic scenario, in the absence of a new variant and with early boosters, we project 0.7M hospitalizations (95% PI 0.2-1.70M) and 111,000 cumulative deaths (95% PI 11,000-212,000).
- Overall, we estimate that early boosters would avert 6-12% of cases, 10-16% of hospitalizations and 12-15% of deaths, depending on the variant scenario.
- A few caveats are worth noting:
- The vaccine coverage assumed in these projections is indexed on the adult influenza vaccine coverage and is deemed optimistic. This assumes both a fast ramp up of vaccination in the month after boosters become available, and a high saturation coverage, above the levels observed for the first COVID-19 booster uptake in late 2021.
- We assumed that boosters would be reformulated in the fall, with a VE of 80% against symptomatic disease immediately after vaccination. The efficacy of reformulated boosters against existing and new variants remains unclear, and so does the pace of waning after multiple booster shots and repeat infections.
- We considered a single booster campaign in the fall-winter 2022-23.
- The new variant introduced in these scenarios is purely hypothetical, and any new variant that does emerge will have different characteristics and timing of arrival.
- Issues with case ascertainment and delays in death reporting make model calibration difficult for these outcomes. Hospitalizations continue to be a reliable outcome.
- We cannot fully project changes in behavior and testing practices as we exit the emergency phase of the pandemic.
Table 1. COVID-19 Scenario Modeling Hub round 15 scenarios. More detailed scenario definitions and model characteristics can be found at https://github.com/midas-network/covid19-scenario-modeling-hub.

A Note on Scenario Modeling Hub Round 14 (July 19, 2022)
In a new round of projections, the Scenario Modeling Hub evaluated the trajectory of COVID-19 in the coming year under different assumptions about the scale of the fall 2022 booster campaign and the emergence of a hypothetical new variant in fall 2022
Our main findings include:
- Absent a new variant, COVID levels may continue to rise nationally and stay elevated through early fall. 50% projection intervals suggest that hospitalizations are unlikely to exceed 60% of the Omicron peak. However, this national pattern masks significant variation in projected trajectories between states
- Not all models project a significant peak to result from the introduction of a new variant, however those that do project peaks in late fall or winter.
- Regardless of the presence of a new variant, over the first fifty weeks of the projection period an extended booster campaign is projected to lead to a greater than 15% reduction in hospitalizations and 10% reduction in deaths relative to the restricted booster scenario. This represents reductions of 348,000 (95% PI: -64,000-759,000) hospitalizations and 43,000 (95% PI: -23,000-108,000) deaths in the no variant scenario at the national level.
- Absent a new variant or change in vaccination policy, over the next fifty weeks 1.7 million (95% PI: 503,000-4.5 million) hospitalizations and 230,000 (95% PI: 29,000-873,000) deaths are projected, with very broad uncertainty.
- We are still in a period of substantial uncertainty about the future and there are significant qualitative differences between individual models, particularly in the long-term. The ensembling methodology may blunt the magnitude of the projected peaks when individual models differ in peak timing.
- As of the release of this report, hospitalization have tracked well with the ensemble projections while deaths have tended to be on the lower end of the projection interval.
- These key takeaways are subject to several limitations/caveats:
- Not all models include BA4/5, and those that do are fit to limited observed data on their circulation.
- Radical changes in case ascertainment and reporting are making models increasingly hard to fit and clouding the comparison between model projections and observed outcomes.
- The efficacy of reformulated vaccines is unknown.
- The new variant introduced in these scenarios is purely hypothetical, and any new variant that does emerge may have very different characteristics.
Table 1. COVID-19 Scenario Modeling Hub round 14 scenarios. More detailed scenario definitions and model characteristics can be found at https://github.com/midas-network/covid19-scenario-modeling-hub.
A Note on Scenario Modeling Hub Round 13 (April 15, 2022)
In a new round of projections, the Scenario Modeling Hub evaluated the trajectory of COVID-19 in the coming year under different assumptions about the durability of the immune response to SARS-CoV-2 and the emergence of a hypothetical new variant in late Spring 2022.
Our main findings include:
- There is high uncertainty in the future trajectory of the pandemic over the 52-week projection period March 2022-March 2023, although outbreaks are projected to be less intense than in the acute phase of the pandemic. There may be occasional periods of increased incidence, although the timing of these periods varies depending on the model considered and assumptions about immunity and variants.
- Moderate rises in hospitalizations and deaths are plausible in the next year, relative to March 2022 levels. A shorter duration of immunity against infection (a median of 4 months vs 10 months) and the arrival of an immune escape variant would hasten these rises.
- Based on a subset of models that include the rise of BA.2 Omicron variant and/or a reduction in social distancing, we anticipate a moderate rise in incidences between April-June 2022.
- During March 2022- 2023, 95,800 cumulative deaths (95% projection interval [PI] 9,000 to 324,000) are projected to occur in the most optimistic scenario (slow waning of immunity and absence of a new variant). This corresponds to 1.06M cumulative deaths (95% PI 0.98-1.29M) since the start of the pandemic, March 2020-March 2023. In the most pessimistic scenario (fast waning and with emergence of an immune escape variant), 211,000 cumulative deaths would occur during March 2022-2023 (95% PI 52,000-466,000).
- See our companion statement regarding the date at which we expect to reach 1M deaths
These projections have several caveats and limitations:
- There is little agreement between models in the timing of future outbreaks.
- The epidemiological characteristics and timing of emergence of future variants is particularly uncertain. Our analysis is limited to the case of a moderate immune escape variant that arises in May 2022.
- It is likely that SARS-CoV-2 testing behavior and reporting of cases and deaths will change in the coming year as COVID19 settles into an endemic pattern. These changes are difficult to fully anticipate and model.
COVID-19 Milestone: Reaching 1 Million Deaths in the United States (COVID-19 Scenario Modeling Hub - April 8, 2022)
As part of the thirteenth round of COVID-19 scenario projections, the COVID-19 Scenario Modeling Hub has aggregated projections from 7 modeling teams and generated ensemble estimates for the date at which the United States will cross 1 million cumulative COVID-19 deaths, for multiple scenarios spanning uncertainties about the persistence of immunity to the virus. While we may be seeing the end of the acute phase of the pandemic, we feel it is important to take a moment and reflect on this somber milestone and the lives lost during two years of the pandemic.
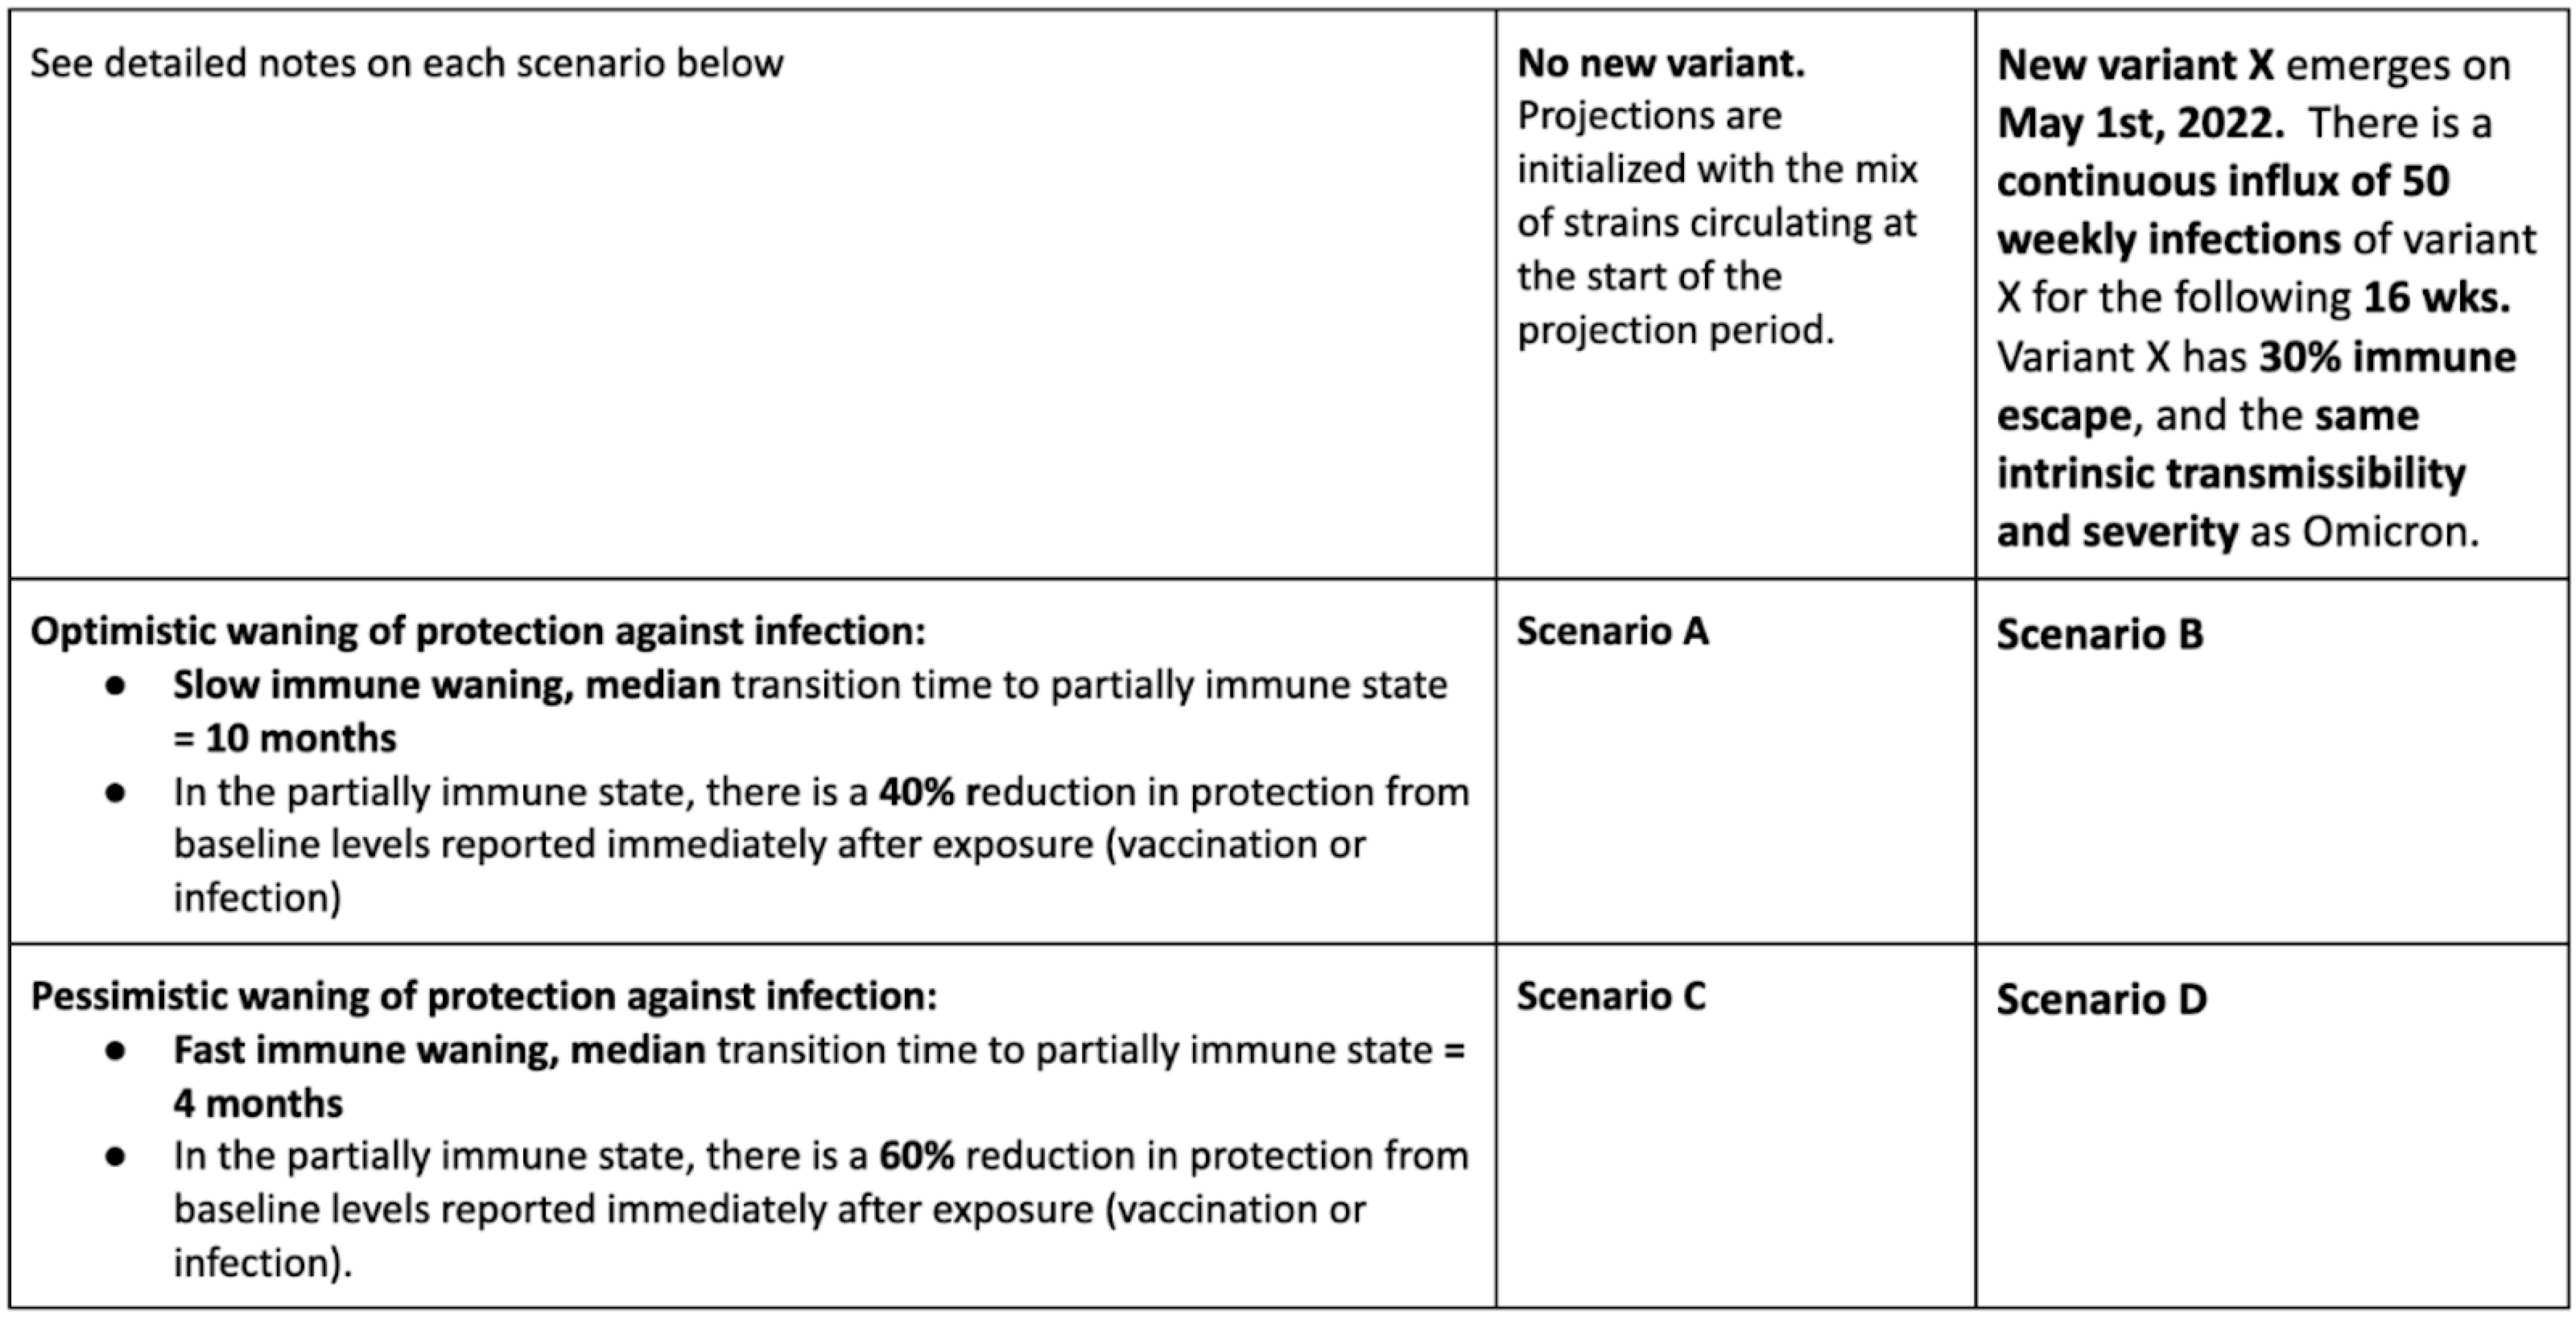
The COVID-19 Scenario Modeling Hub estimates that, absent the emergence of a new variant, the United States will most likely cross 1 million deaths in June or early July 2022 (see Figure). However, there is substantial uncertainty as to when we will reach this milestone, with the range of dates this event is likely to occur (i.e., the 50% projection interval) spanning May 5 to November 14 at the time projections were made (March 13, 2022). This range captures both the uncertainty between individual models, uncertainty within models, and uncertainty about exactly how long immunity against COVID-19 persists (as detailed in Scenarios A and C).
The emergence of a new variant or other unforeseen event could accelerate this timeline. While it is impossible to know what the properties and timing of such a variant would be, in this round the COVID-19 Scenario Modeling Hub did consider scenarios where a hypothetical variant with moderate immune escape emerged and started circulating in the United States on May 1, 2022. While the considered hypothetical variant did not substantially impact the earliest or most likely time we might see deaths cross 1 million, it did make a longer wait until this milestone less plausible.
These projections come with the caveat that there also continues to be high variability in the reporting of COVID-19 deaths. There have been notable changes in death reporting in recent months in US states which makes model calibration difficult, and may affect our projections. There have also been substantial backfilling and negating of reported deaths in recent months, so we may be closer (or even past) or further from this milestone than we currently realize. We also should acknowledge that it is likely we have already passed this milestone given that many deaths from COVID-19 may not be identified as such, and 1.1 million excess deaths have been estimated to have already occurred (https://www.economist.com/graphic-detail/coronavirus-excess-deaths-tracker).
Figure. Estimates of the date at which the United States crosses 1 million cumulative deaths nationally, from round 13 of the COVID-19 Scenario Modeling Hub.
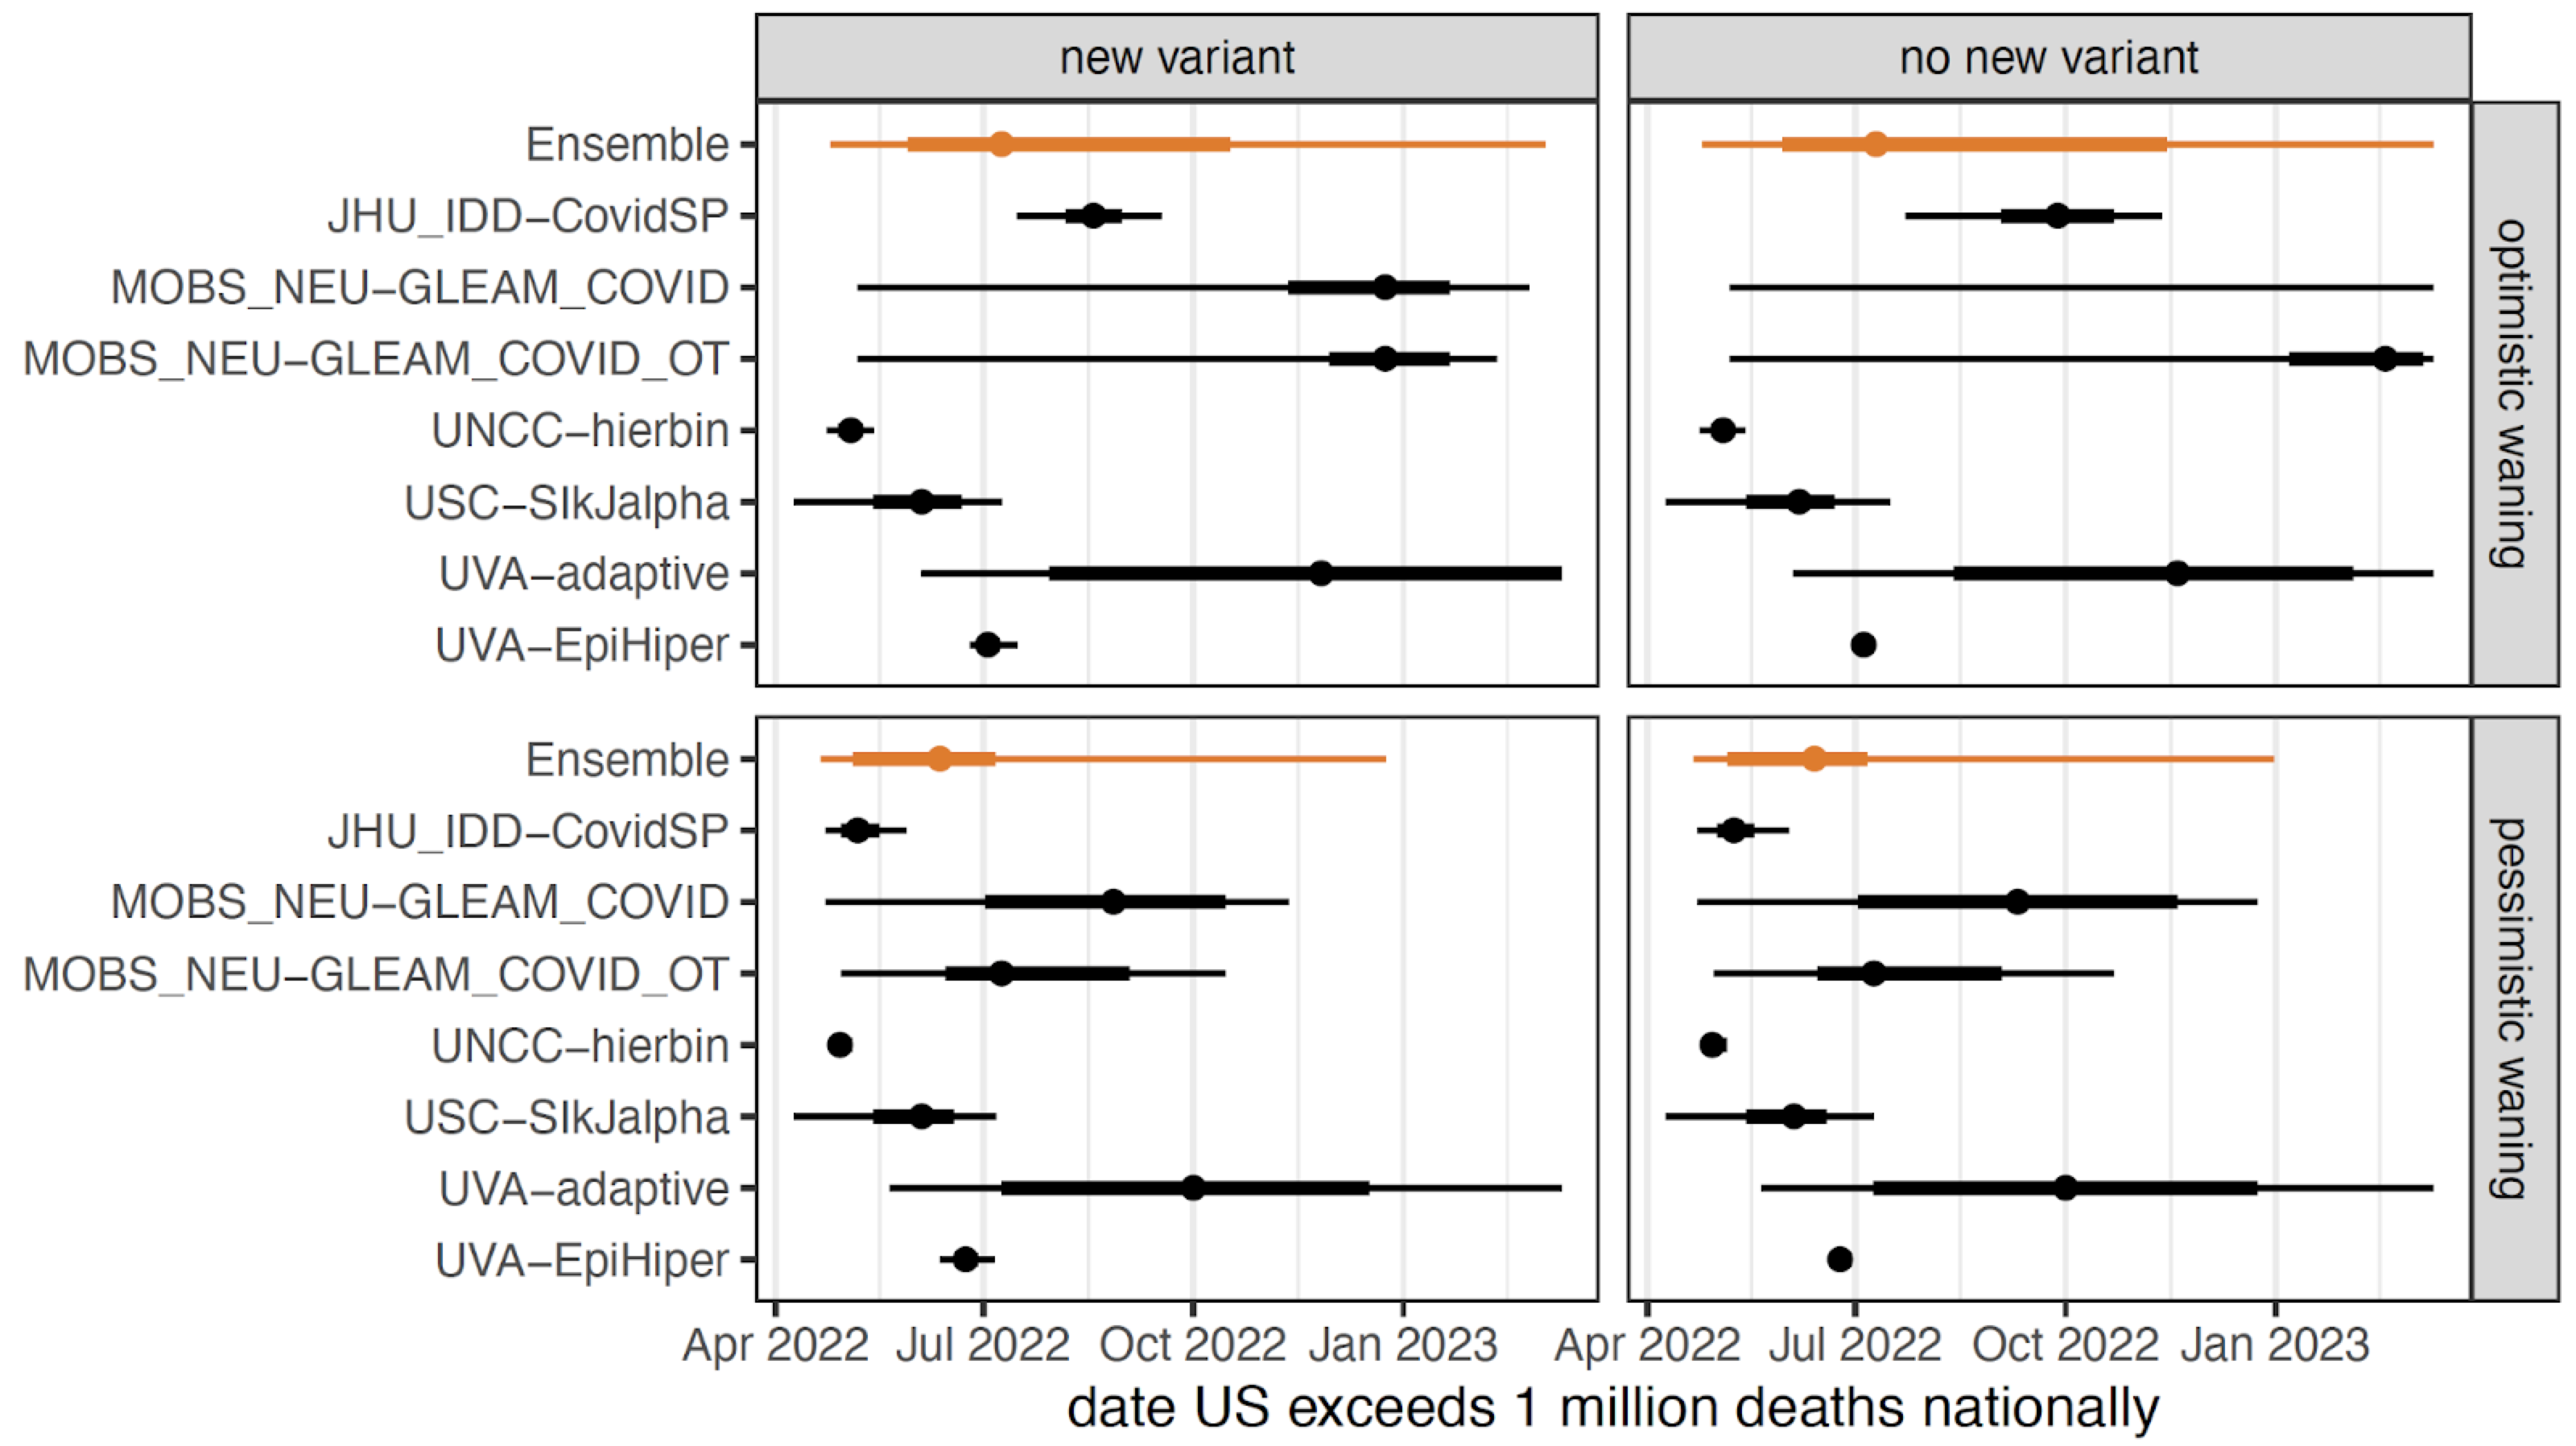
Table 1. Ensemble estimates of the date to crossing 1 million reported deaths nationally in the US for four scenarios. Estimates are reported as median and interquartile range (in parentheses).
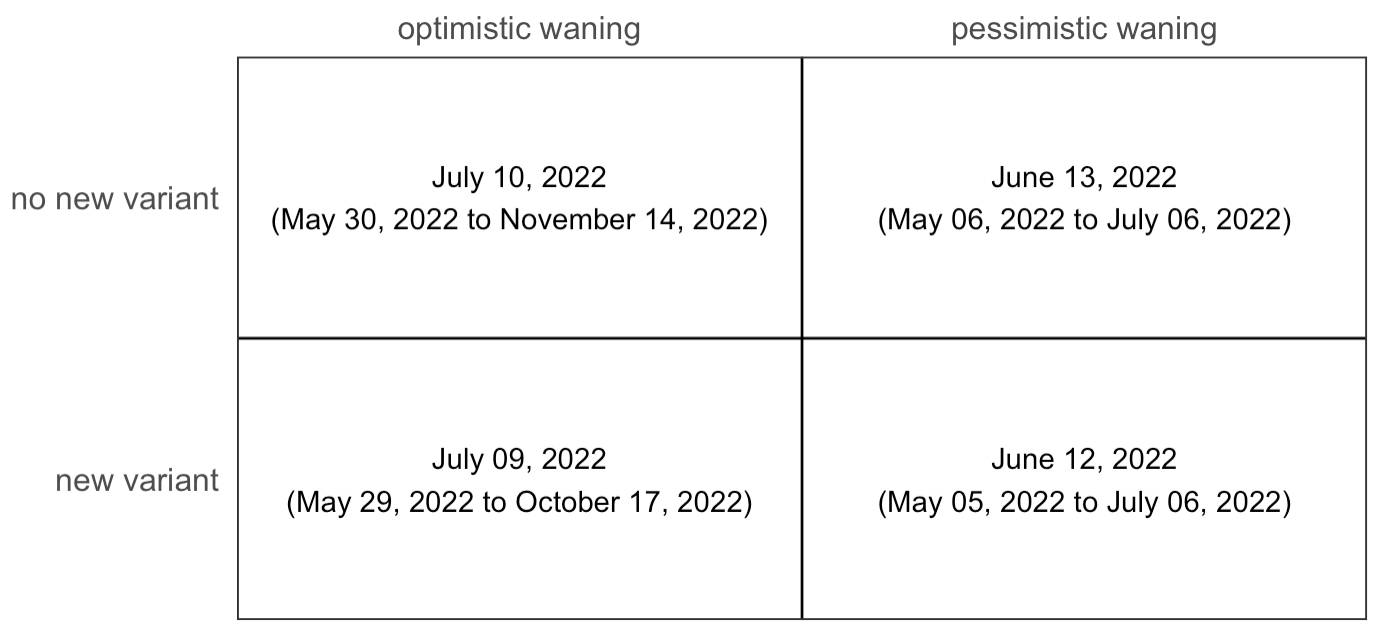
Table 2. COVID-19 Scenario Modeling Hub round 13 scenarios. More detailed scenario definitions and model characteristics can be found at https://github.com/midas-network/covid19-scenario-modeling-hub.
A Note on Scenario Modeling Hub Round 12 (January 26, 2022)
Round 12 is focused on the impact of the Omicron variant in the United States and updates an earlier “emergency” round. We aim to provide a set of planning scenarios around this variant. With updated severity information that has become available since our emergency round, we now provide 4 plausible scenarios that address different levels of severity and immune escape for Omicron. To reflect residual uncertainty in the characteristics of the Omicron variant, we focus on the projection interval rather than the central estimates from the ensemble.
We note several key takeaways from this round:
- Most models project that both cases and hospitalizations peak before the end of January 2022 in most states. The peak is expected to occur earlier in the North East than in the rest of the country.
- At the end of projection period in early April 2022, incidence is projected to drop to low levels, assuming no new immune escape variant.
- In the scenario with low immune escape and optimistic severity, we expect incident national hospitalizations to peak at 146,000 per week (95% PI 94,000-255,000) in the week of January 15th, 2022. In the scenario with high immune escape and high severity we expect national hospitalizations to peak at 193,000 per week (95% PI 79,000-507,000) in the week of Jan 22nd, 2022. Assumptions about immune escape have a low impact on all projections.
- Nationally during the projection period (January 15 to Apr 2, 2022), we expect between 250,000 and 2,036,00 cumulative hospitalizations and 13,000-97,000 cumulative deaths resulting from the Omicron wave in the low immune escape and optimistic severity scenario. There are variations in cumulative estimates between scenarios.
- Substantial uncertainty remains,
notably:
- The intrinsic severity of Omicron and the protection afforded by full vaccine schedules and boosters remain debated.
- Data are scarce on the serial interval for the Omicron variant. A shorter serial interval would result in a lower transmissibility advantage over Delta; hence a smaller Omicron wave.
- Case projections should be considered with caution due to potential changes in case ascertainment in the Omicron era. Issues include higher rates of asymptomatic infections, unreported positive home tests, and saturation in testing due to the sheer volume of Omicron infections.
- There is uncertainty in the duration of protection from reinfection and the possible persistence of the Delta variant, which may affect estimates towards the end of the projection period.
A Note on Scenario Modeling Hub Round 11 (January 4, 2022)
Round 11, focused on the impact of the Omicron variant in the United States, is an “emergency” round aimed at providing a timely set of planning scenarios around this variant. Because of the developing situation, these scenarios were necessarily based on the best evidence at the time of their specification, and new information may deviate from main assumptions. Notably, at this point only the “low-severity” scenarios are considered plausible (scenarios A & B, the scenarios selected by default). Additionally, to reflect the larger uncertainty of this round, we focus on the projection intervals rather than the central estimates from the ensemble.
Despite the inherent uncertainty in this developing situation, their remain several key takeaways from this round:
- The Omicron wave is projected to be sharp and fast in all scenarios, with most models projecting both cases and hospitalizations to peak before the end of January 2022 in every state (all models project peaks before the end of February 2022).
- Cases, hospitalizations, and deaths will likely have receded substantially from the peak by the end of the projection period (March 12, 2022), but are projected to remain elevated compared to June 2021 (the lowest levels seen in the pandemic so far).
- Weekly national hospitalizations could peak at substantially higher levels than reported since the start of the pandemic, with the upper bound of the 95% projection interval reaching 280% of the winter 2020-2021 peak, and 370% of the Delta peak (August- November 2021) in low severity scenarios.
- Nationally during the projection period (December 19, 2021 to March 12, 2022) we expect to see between 409,000-2,380,000 cumulative hospitalizations and 54,000-304,000 deaths. Expected hospitalizations and deaths vary by scenario, with an ensemble median estimate of 832,000 hospitalizations in scenario A and 1,547,000 in scenario B.
- Substantial uncertainty remains,
notably:
- Contributing models show a high level of qualitative and quantitative heterogeneity, reflecting high levels of uncertainty (though models agree on key points as noted above).
- There is still uncertainty around the epidemiology and severity of Omicron, some of which (e.g., a possible shortened generation time and risk of severe outcomes in naive individuals) could substantially impact projections.
- Case projections, particularly, should be considered with caution due to potential changes in the definition and identification of a case during the Omicron wave.
Statement of the COVID-19 Scenario Modeling Hub on the Coming Omicron Wave of COVID-19 Cases, Hospitalizations, and Deaths in the United States (December 22, 2021)
We are a consortium of scientists who contribute to the COVID-19 Scenario Modeling Hub. Currently, we are working to produce a round of planning scenarios to help policymakers and the public prepare for the potential impact of the Omicron variant of SARS-CoV-2 that is spreading rapidly in the United States and throughout the world. This process entails careful scenario specification, running of complex models by multiple independent teams, comparison and review of projections, and summarizing the results using formal techniques. Although we have not completed this round (Round 11), preliminary projections from multiple models raise deep concerns about the speed and severity of the coming Omicron wave. This urgency is further fueled by the unprecedented speed at which the Omicron variant has become the dominant strain in many areas. We believe it is important to share these preliminary results to help individuals and institutions prepare for potential surges in cases and healthcare demand.
The planning scenario projections produced so far universally show a large wave of COVID-19 cases that will likely exceed numbers seen nationally at the peak of the Delta wave by the first week of January 2022. While it is clear that the wave of COVID-19 infections will be large, it is less clear what Omicron’s impact will be in terms of hospitalizations and deaths, as much remains uncertain regarding the severity of primary, secondary and breakthrough infections with Omicron compared to what was witnessed for Delta and prior variants. The scenarios considered by the COVID-19 Scenario Modeling Hub capture a range of possible severities for the Omicron variant consistent with current evidence. Depending on severity, preliminary projections of weekly hospitalizations range from levels twice as high as any previously observed in the United States during the pandemic, to levels around half of what was seen at the peak of the Delta wave. Regardless of where the relative severity of Omicron falls, the sheer number of cases projected means that even a relatively mild severity of the Omicron variant has the potential to severely stress, if not overwhelm, already strained health care systems across the country. This includes straining our ability to provide COVID-19 testing to all who need it. There is substantial uncertainty underlying these projections, but they remain one of the best tools at our disposal to prepare for the effects of Omicron in the face of significant uncertainty.
The work of the COVID-19 Scenario Modeling Hub teams, multiple other modeling groups world wide, and the epidemic situation in countries where Omicron is already widespread, all indicate that the United States must be prepared to face an unprecedented wave of COVID-19 cases in the coming weeks and months. However, we are not helpless in the face of the coming wave, and have proven tools to blunt its impact. Physical distancing, limiting gatherings and masking have repeatedly proven themselves effective in slowing the spread of the virus. Vaccination, even if somewhat less effective due to Omicron’s immune escape, remains one of the best ways to reduce the risk of severe outcomes if infected and still reduces the chances of passing on the virus to others. Reassuringly, boosters have been shown to reduce the risk of symptomatic Omicron infections, and hence will likely provide high levels of protection against hospitalization and death; yet only 30% of those eligible in the US have received a booster shot. Antigen testing also provides an important tool to help prevent spread at holiday gatherings, though the availability of these tests has become limited in recent weeks. To the extent to which individuals and communities proactively use these tools, many of the worst outcomes projected by our models may not come to pass.
The COVID-19 Scenario Modeling Hub is working towards a rapid release of more formal planning scenarios assessing the threats posed by the Omicron wave. It will be important to understand the potential impact of the Omicron wave in different US jurisdictions that have various levels of population immunity. These COVID-19 Scenario Modeling Hub projections will undoubtedly be augmented by other critical information that will emerge in the coming weeks pertaining to viral characteristics, immune response, severity, and population level impact. However, the best information we have at the moment indicates the threat posed by Omicron is substantial and imminent, and individuals and governments should be prepared to respond accordingly.
Signed- Justin Lessler, UNC Gillings School of Public Health
- Katriona Shea, The Pennsylvania State University
- Rebecca Borchering, The Pennsylvania State University
- Cecile Viboud, Fogarty International Center, NIH
- Shaun Truelove, Johns Hopkins Bloomberg School of Public Health
- Spencer Fox, The University of Texas at Austin
- Bryan Lewis, University of Virginia
- Srini Venkatramanan, University of Virginia
- Przemyslaw Porebski, University of Virginia
- Alessandro Vespignani, Northeastern University
- Matteo Chinazzi, Northeastern University
- Ajitesh Srivastava, University of Southern California
- Harry Hochheiser, University of Pittsburgh
- Emily Howerton, The Pennsylvania State University
- Claire P. Smith, Johns Hopkins Bloomberg School of Public Health
- Shi Chen, University of North Carolina at Charlotte
- Thomas Hladish, University of Florida
- Alexander N. Pillai, University of Florida
- Jiangzhuo Chen, University of Virginia
- Guido Camargo España, University of Notre Dame
